Solana is showing bullish momentum as its price rises above $100. This signals a potential increase, with SOL’s price possibly rallying even higher towards the $112 mark.
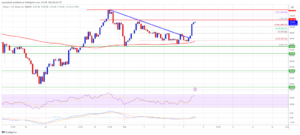
Starting from the $93.20 support against the US Dollar, SOL price has begun a new uptrend. It’s currently trading above $98 and the 100 simple moving average (4 hours). On the 4-hour chart of the SOL/USD pair from Kraken, there was a significant breakthrough above a major bearish trend line with resistance at $96. If the pair manages to surpass the resistance levels at $102.50 and $105.00, the rally may continue.
Solana Shows Strong Growth Momentum
Solana’s price has established a support base above the $93.20 zone and has recently initiated a fresh uptrend. This uptick saw a notable rise above the $96 and $98 levels.
With a surge of over 7%, Solana surpassed the $100 mark, showcasing a stronger performance compared to Bitcoin and Ethereum. During this climb, it also surpassed the 76.4% Fibonacci retracement level of the previous downward movement from the $102.46 swing high to the $93.17 low.
Additionally, a significant breakthrough occurred above a major bearish trend line with resistance at $96 on the 4-hour chart of the SOL/USD pair. Presently, Solana is trading above $98 and the 100 simple moving average (4 hours).

Source: SOLUSD on TradingView.com
Immediate resistance lies near the $102.50 level, followed by a major hurdle at $105. A successful close above this $105 resistance could pave the way for another substantial increase. The subsequent key resistance stands at $112, with further gains potentially pushing the price toward the $120 level.
Potential Downside Scenarios for Solana (SOL) Price
If Solana fails to surpass the $105 resistance level, it could initiate a downside correction. Initial support on the downside is anticipated near the $98 level.
The first major support level is positioned near $96, closely aligned with the 100 simple moving average (4 hours). If this level is breached, the price may test the critical support at $93.20. A close below this level could prompt a decline toward the $85 support in the short term.
Technical Indicators
- 4-Hour MACD: The MACD for SOL/USD is exhibiting an uptrend in the bullish zone.
- 4-Hour RSI (Relative Strength Index): The RSI for SOL/USD is above the 50 level, indicating bullish momentum.
- Major Support Levels: $96 and $93.20.
- Major Resistance Levels: $102.50, $105, and $112.
Important: Please note that this article is only meant to provide information and should not be taken as legal, tax, investment, financial, or any other type of advice.
Join Cryptos Headlines Community
Follow Cryptos Headlines on Google News


