- After consolidating, Bitcoin once again jumped above the $91k mark.
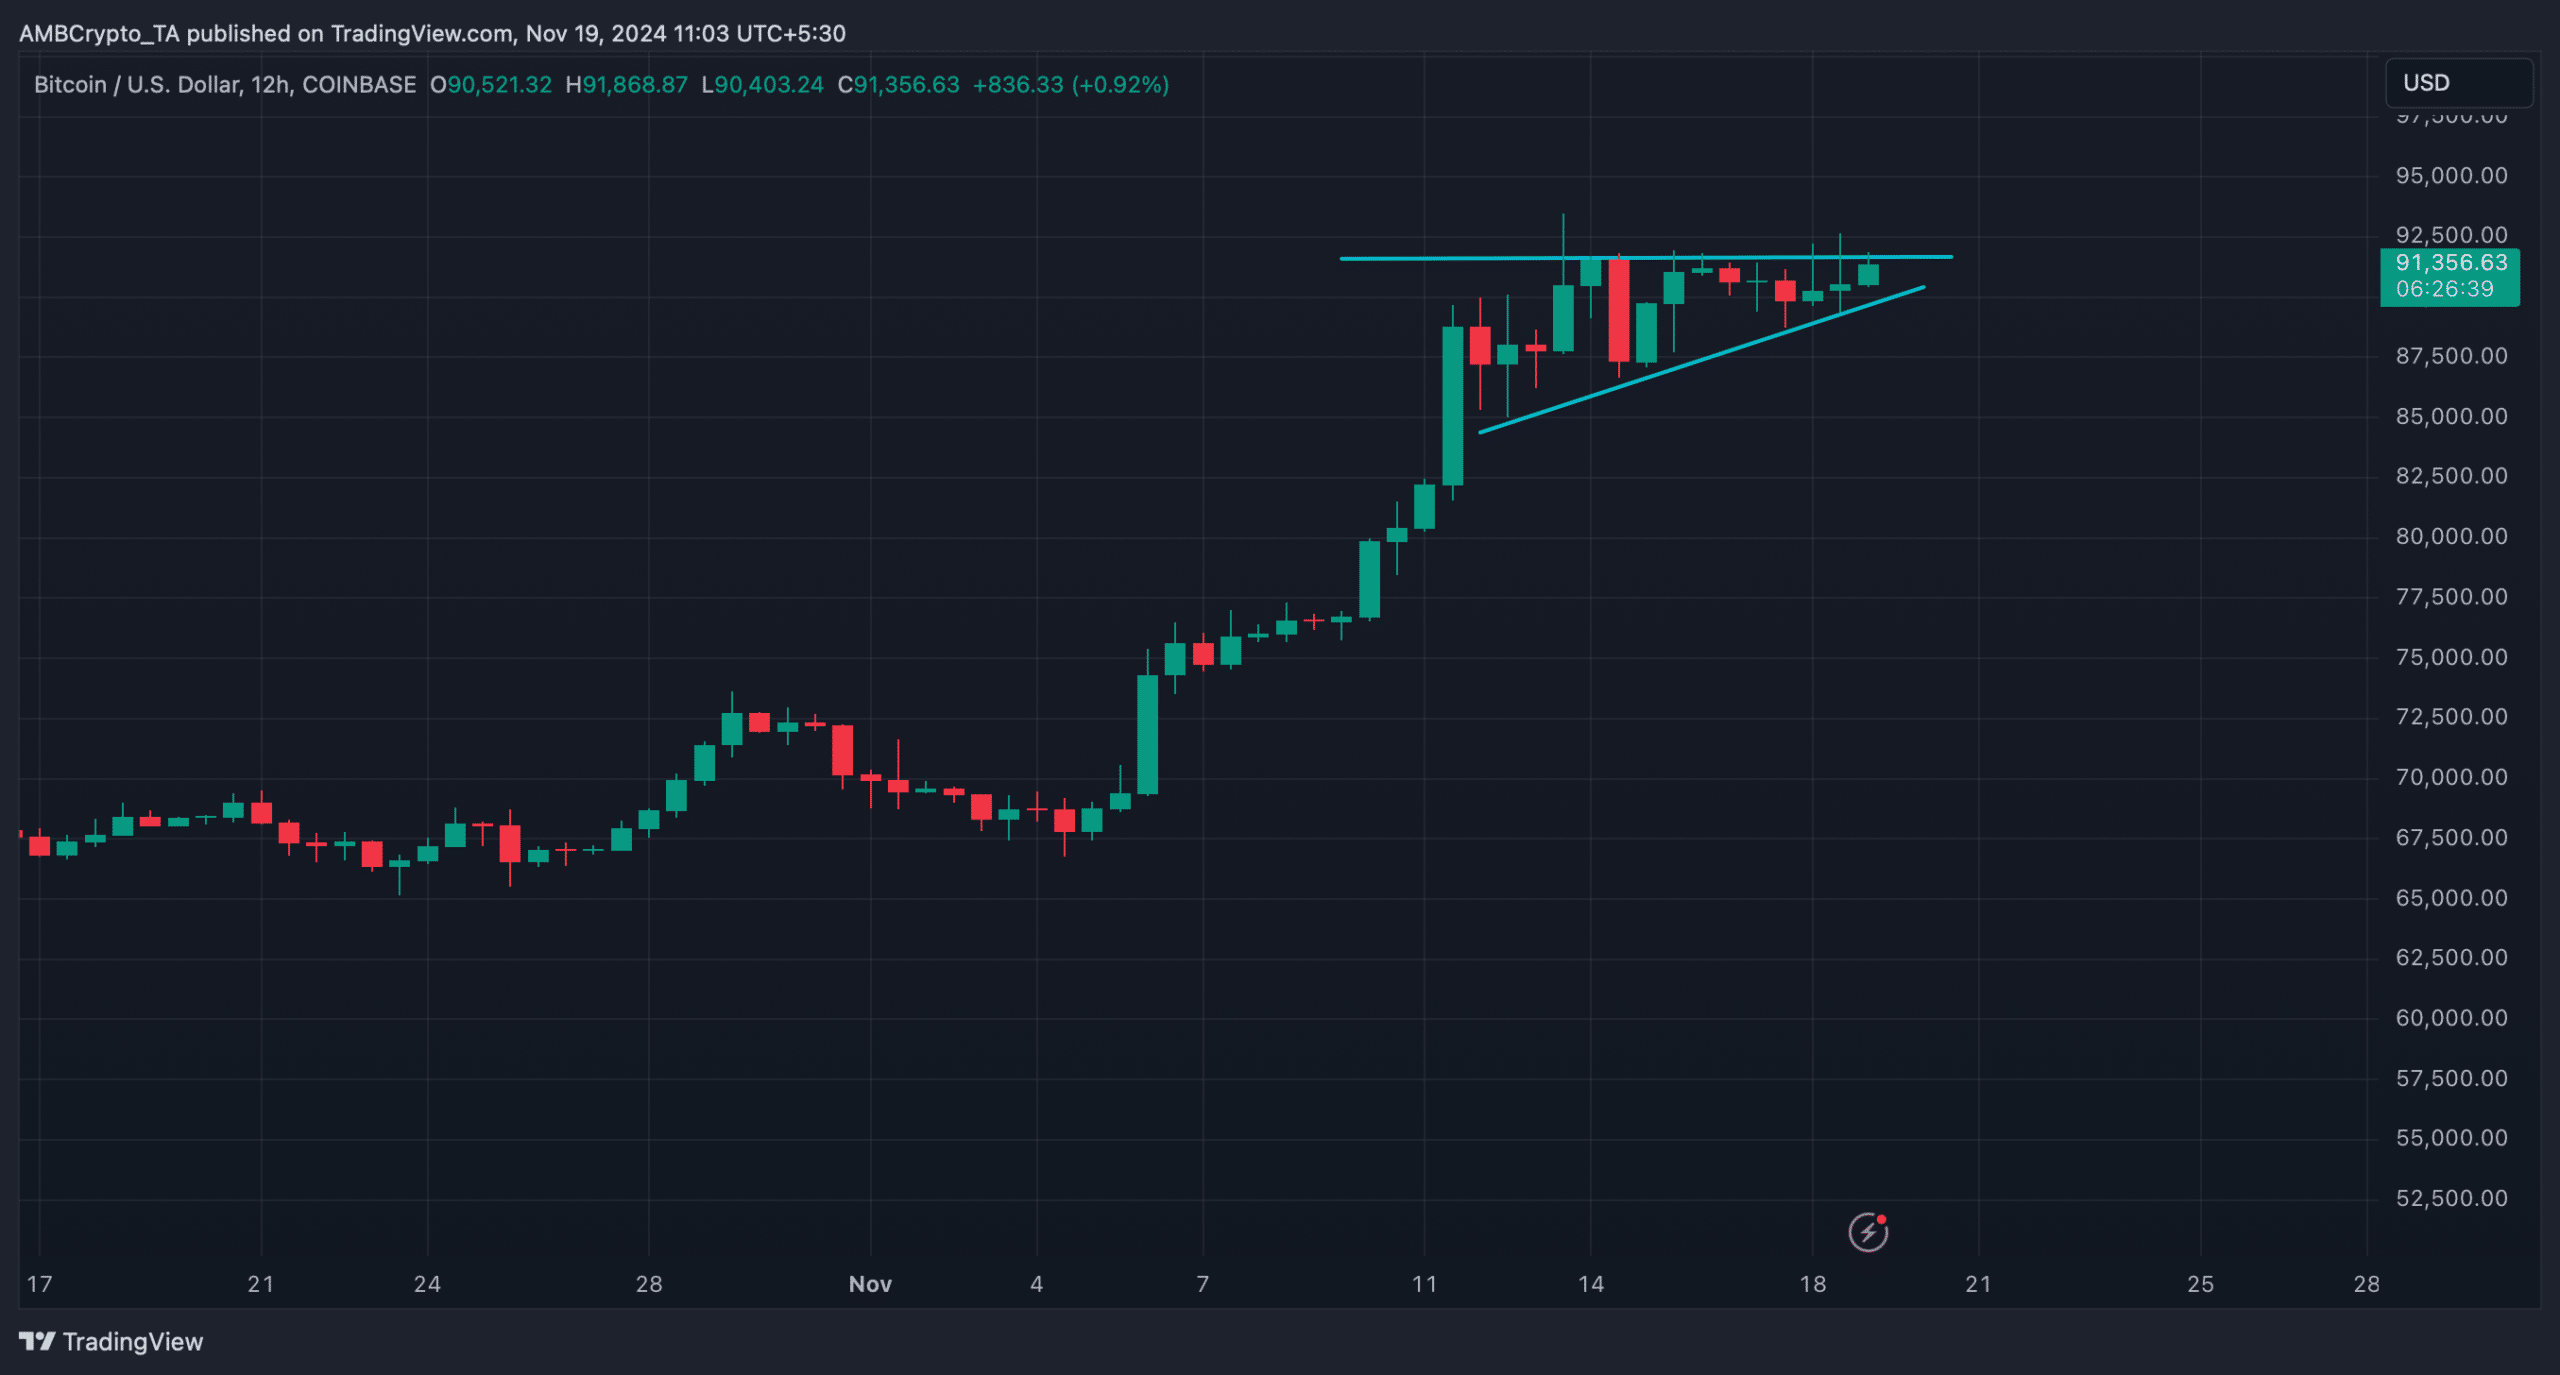
- BTC was testing the resistance of a bullish ascending triangle pattern.
Unlike the last time, Bitcoin [BTC] took a few days to finally go above the $91k mark gain. But this just might be the beginning of a fresh rally. This seemed to be the case as BTC was mirroring its past trend, which suggested that the king coin might hit $100k sooner than expected.
Bitcoin turns bullish again
After touching an all-time high, BTC witnessed a pullback, but it managed to trade above the $90k mark as it started to consolidate. AMBCrypto reported earlier that a possible reason behind this could be the 3,000 BTC sell-off by miners.
Bitcoin’s capacity to maintain above $90,000 indicated significant market confidence, even though miner profit-taking resulted in an increase in supply.
In fact, investors’ confidence did pay off as BTC’s price increased by nearly 2% in the past 24 hours, allowing it to jump above $91k.
Meanwhile, Ali, a popular crypto analyst, recently posted a tweet highlighting a notable development.
As per the tweet, Bitcoin was mimicking a past trend. In 2020, after Bitcoin broke its previous all-time high of $19,700, it surged 26%, consolidated for a week, then jumped to $40,000.
A similar trend was seen this time. To be precise, BTC has risen 28% after surpassing its previous ATH and has been consolidating for the past six days. As history was repeating itself, BTC next to target $100k isn’t a too ambitious expectation.
Is BTC targeting $100k next?
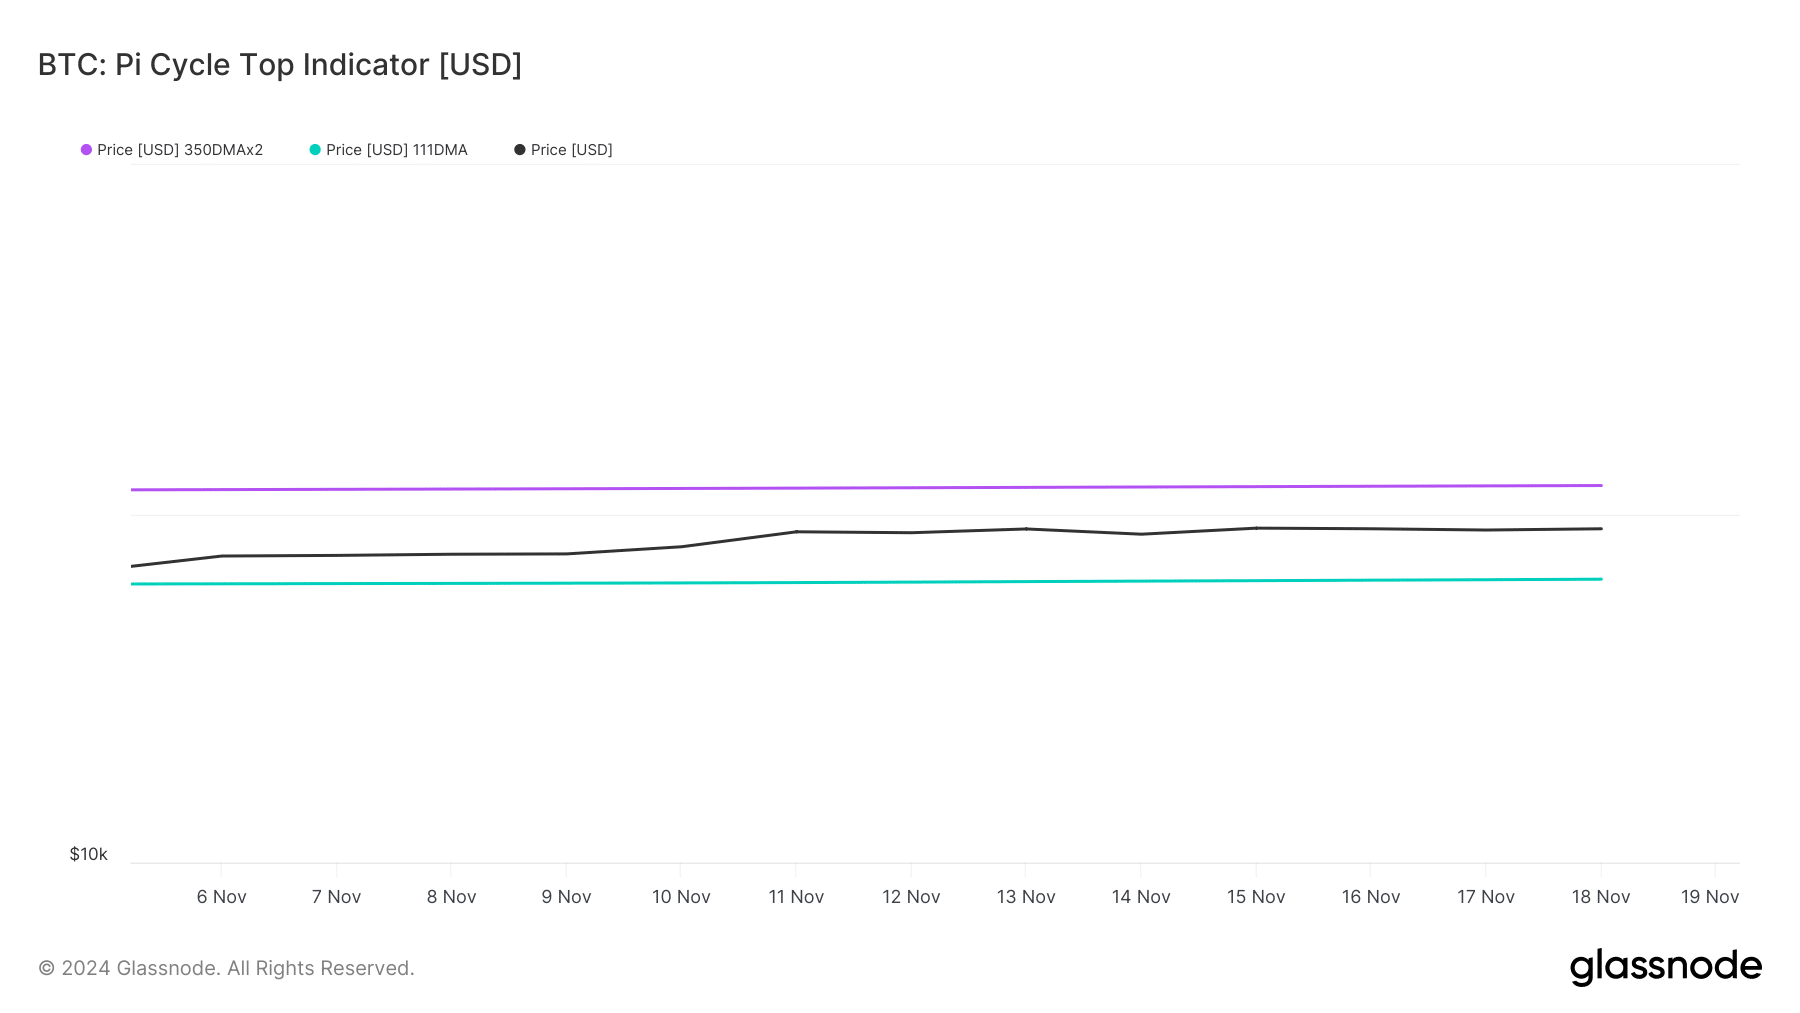
The Pi Cycle Top indicator pointed out that Bitcoin was trading well above its supposed market bottom of $64.9k. If the indicator is to be believed, then BTC’s possible market top was at $120k.
Therefore, expecting BTC targeting $100k next, in case of a rise in volatility, wouldn’t be a long shot.
Glassnode’s data also pointed out whales’ confidence in the king coin increased over the past few weeks. This was evident from the rise in the number of BTC addresses holding more than $1 billion, which can fuel a price rise.
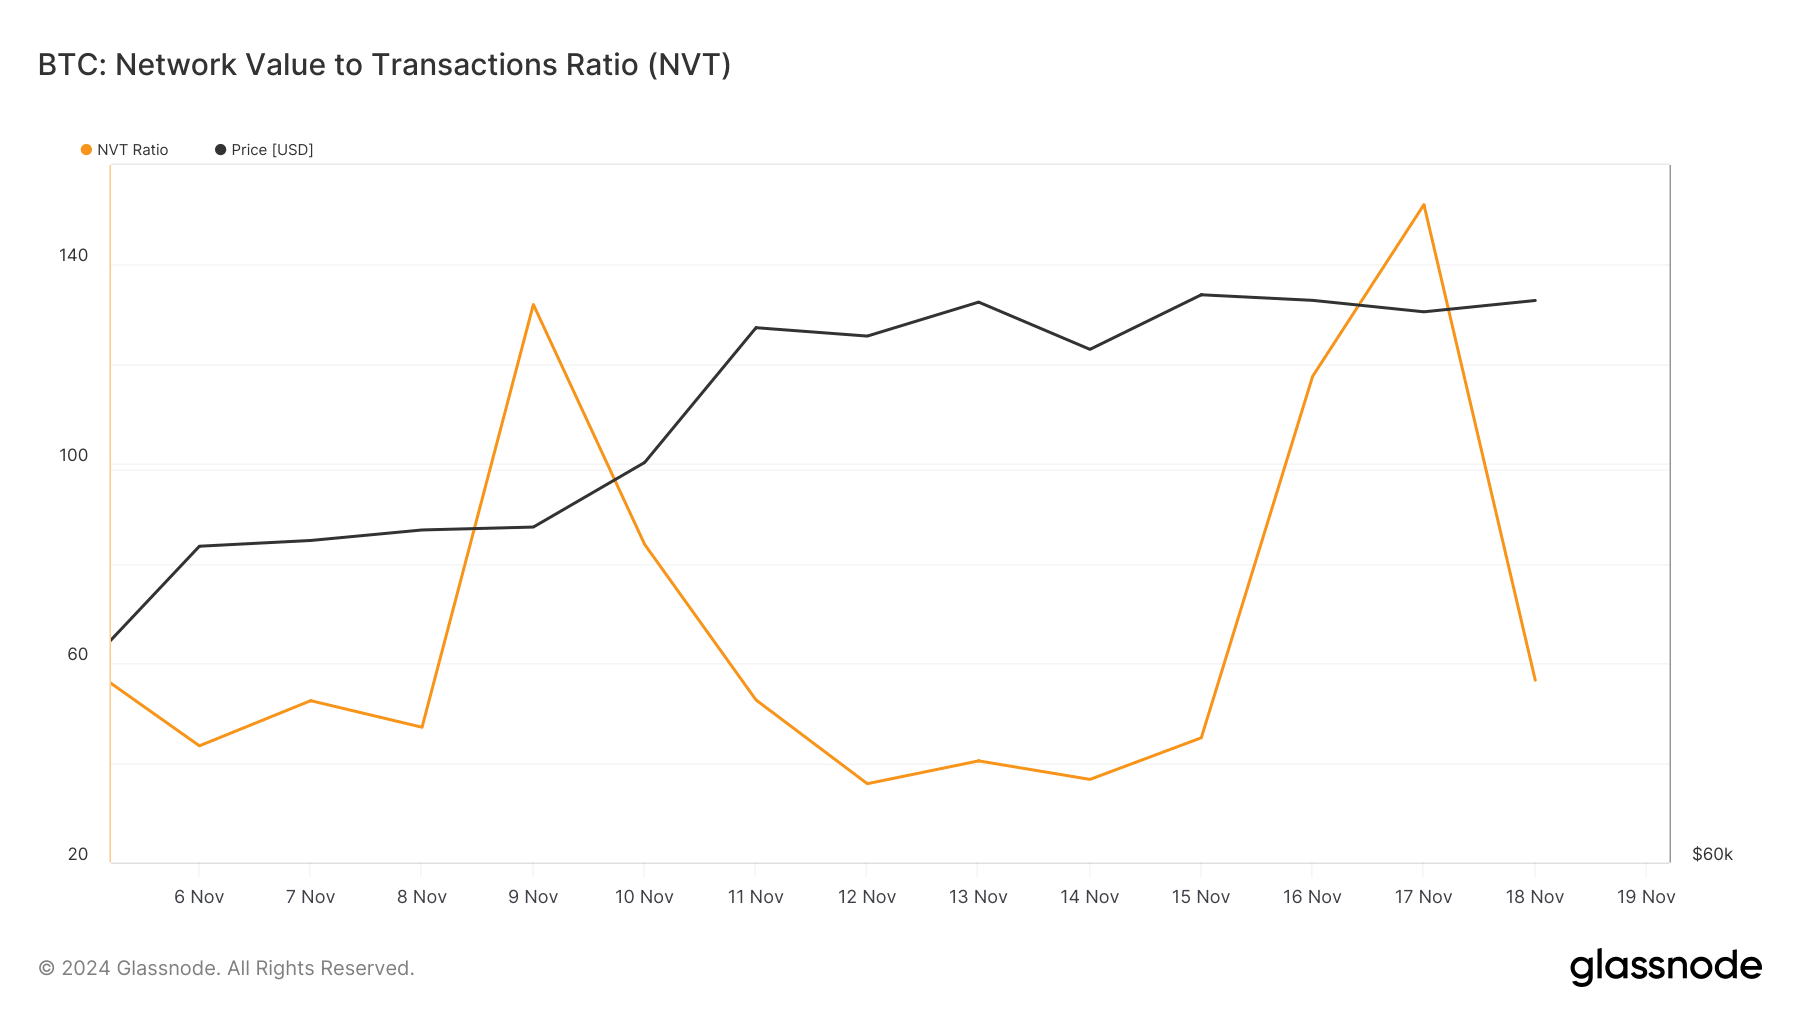
Additionally, after a sharp rise, BTC’s NVT ratio dipped. A decline in the metric means that an asset is undervalued, suggesting a price hike soon.
AMBCrypto’s analysis revealed that a bullish ascending triangle pattern formed on BTC’s 12-hour chart. At press time, the king coin was testing the resistance of the pattern.
Read Bitcoin’s [BTC] Price Prediction 2024–2025
If Bitcoin manages to break above that level, then it won’t be surprising to see a fresh bull run, pushing the coin to $100k.


