The price of BNB is making a new attempt to rise from the $575 area. With a gain of over 5%, the bulls are showing strength and appear to be targeting a move beyond $620.
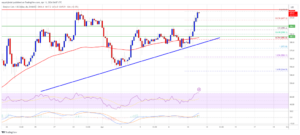
After finding support near the $575 zone, the price of BNB initiated a new uptrend. It has now surpassed $600 and the 100 simple moving average (4 hours). On the 4-hour chart of the BNB/USD pair from Binance, a significant bullish trend line is forming, with support at $587. If the pair manages to break above the $620 resistance zone, it could gather further bullish momentum.
BNB Price Shows Strength with Bullish Momentum
Following a downside correction below $600, the price of BNB found support around the $575 zone, forming a low at $572.8. Unlike Ethereum and Bitcoin, BNB started a fresh uptrend from this point.
The bulls successfully pushed the price above the $595 and $600 resistance levels, as well as the $605 pivot level. With an increase of over 5%, BNB is displaying several positive signs above the 23.6% Fibonacci retracement level.
Currently, the price is trading above $600 and the 100 simple moving average (4 hours). Additionally, a crucial bullish trend line is forming with support at $587 on the 4-hour chart of the BNB/USD pair.

Source: BNBUSD on TradingView.com
Immediate resistance is expected near the $618 level, followed by the $620 level. A clear breakthrough above the $620 zone could propel the price even higher. In such a scenario, BNB price might test $632, with a close above this resistance potentially leading to a larger increase towards the $650 resistance level. Further gains could even prompt a test of the $700 level in the coming days.
BNB Faces Resistance with Downside Risk Looming
Potential Downside Correction: Should BNB fail to surpass the $620 resistance level, a downside correction could ensue. Initial support on the downside is anticipated near the $600 level.
Key Support Levels: The next significant support level lies around $590, coinciding with the trend line or the 61.8% Fibonacci retracement level of the recent upward move from $572.8 to $618.0. The primary support zone rests at $575. A breach below this level might lead to a decline towards the $562 support, potentially sparking further losses towards the $550 level.
Technical Indicators: The 4-hour MACD indicator for BNB/USD is showing an increase in bullish momentum, while the 4-hour RSI (Relative Strength Index) is currently above the 50 level, indicating bullish sentiment.
Major Support and Resistance Levels: Major support levels to monitor include $600, $585, and $575, while significant resistance levels stand at $620, $632, and $650.
Important: Please note that this article is only meant to provide information and should not be taken as legal, tax, investment, financial, or any other type of advice.
Join Cryptos Headlines Community
Follow Cryptos Headlines on Google News


