MATIC recently turned bearish, but its exit from a bullish pattern hints at potential future improvement. The $1.11 resistance level might impact MATIC’s short-term price direction.
In the cryptocurrency market, Polygon (MATIC) has experienced significant fluctuations. Despite a recent shift towards bearish sentiment on the daily chart after a week of growth, experts advise against immediate worry. MATIC’s emergence from a bullish setup suggests a potential positive trend ahead.
Polygon’s Recent Price Movement
During the past week, Polygon witnessed a significant increase of over 4% in its value, a positive development for investors. However, this momentum appeared to reverse in the last 24 hours, as the asset experienced a 2% dip in its price, according to CoinMarketCap data.
As of now, MATIC is valued at $0.9905, supported by a substantial market capitalization of just over $9.4 billion. This highlights its significant role in the cryptocurrency market.
World of Charts, a reputable entity on X (formerly Twitter), noted that MATIC is moving away from a bullish triangle pattern. This technical shift often signals potential future gains, sparking speculative discussions among traders about the token’s short-term direction.
Finally Breakout & Retest Has Confirmed As Exoected Massive Volume Coming In Expecting Massive Bullish Wave Can Start Anytime Now As The Trend Is Up In #Crypto Its Easy To Find Entries With In Direction Of Trend https://t.co/m47r0ajzHi pic.twitter.com/SSg5lrCquC
— World Of Charts (@WorldOfCharts1) February 24, 2024
Analyzing MATIC’s Market Dynamics
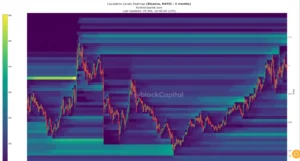
A detailed analysis of MATIC’s liquidation heatmap unveiled specific resistance areas that could influence its future price trajectory. Of particular note is the $1.11 price point, identified as a significant resistance level. A surge in liquidation at this level could intensify selling pressure, potentially impacting the token’s valuation negatively.

Source: Hyblock Capital
One notable discovery was the decrease in MATIC’s exchange reserve, typically signaling bullish momentum and reduced selling pressure. However, other indicators painted a more nuanced picture. The MVRV ratio declined, and accumulation of MATIC by major addresses was minimal, indicating a lack of commitment from large investors.

Source: Santiment
There was also a slight decrease in network activity, evidenced by a drop in the number of daily active addresses. Additionally, technical indicators such as the MACD suggested a potential bearish crossover, adding complexity to MATIC’s current market position.

Source: TradingView
Despite these challenges, some indicators offered optimism. The Money Flow Index (MFI) remained comfortably above the neutral point, and MATIC’s price continued to hold above its 20-day Simple Moving Average (SMA). These factors could support MATIC’s recovery, providing hope for investors anticipating signs of the token’s resilience.
Important: Please note that this article is only meant to provide information and should not be taken as legal, tax, investment, financial, or any other type of advice.
Join Cryptos Headlines Community
Follow Cryptos Headlines on Google News


