

 CaryptosHeadlines Media Has Launched Its Native Token CHT.
Airdrop Is Live For Everyone, Claim Instant 5000 CHT Tokens Worth Of $50 USDT.
Join the Airdrop at the official website,
CryptosHeadlinesToken.com
CaryptosHeadlines Media Has Launched Its Native Token CHT.
Airdrop Is Live For Everyone, Claim Instant 5000 CHT Tokens Worth Of $50 USDT.
Join the Airdrop at the official website,
CryptosHeadlinesToken.com
Bitcoin price is experiencing a quick decline in funding rates and short sellers reduce their activity while miners extract significant profits.
Meanwhile, the current market indicators point toward an optimal situation for a substantial price surge, although some investors interpret this pattern as negative.
Funding Rate Drop: A Bearish Signal or a Bullish Trap?
The funding rate serves as a critical market monitoring tool because it reveals which positions between longs and shorts hold dominance.
According to CryptoQuant data, the 30-day Simple Moving Average (SMA) of the funding rate recorded a 9% drop starting from March.
A sustained downward funding rate trend may turn into a negative rate, which forces traders to pay for holding long positions rather than short positions.
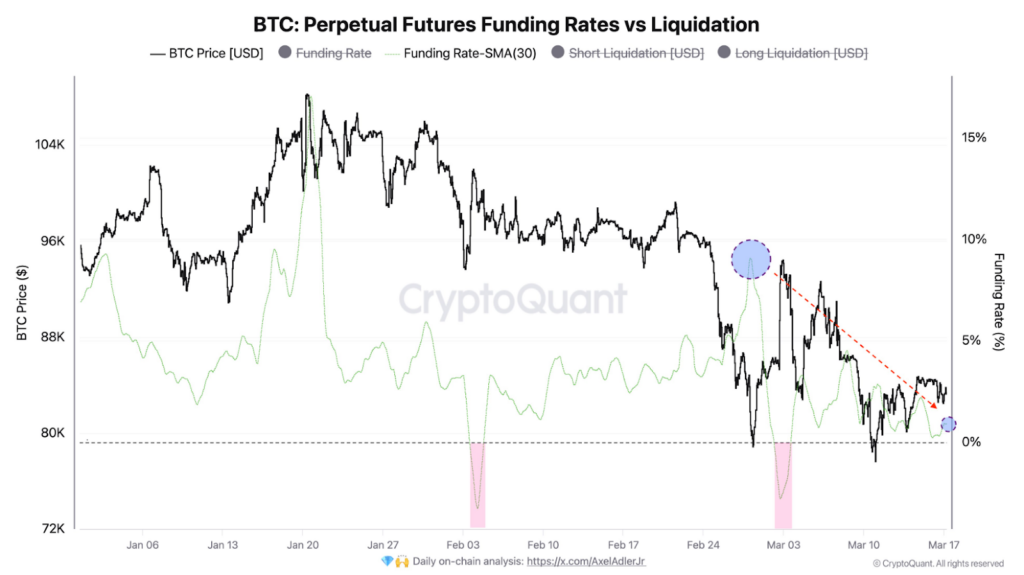
A negative funding rate typically indicates bearish market sentiment, yet, it creates conditions for a short squeeze to occur.
The market sees negative funding as a sign of additional price decline, which can lead traders to heavily short Bitcoin.
However, an unexpected price rise or stabilization forces short sellers to close their positions, which leads to quick market upward momentum.
At the same time, the net taker volume indicator, which measures aggressive market actions, shows substantial bearish pressure reduction.
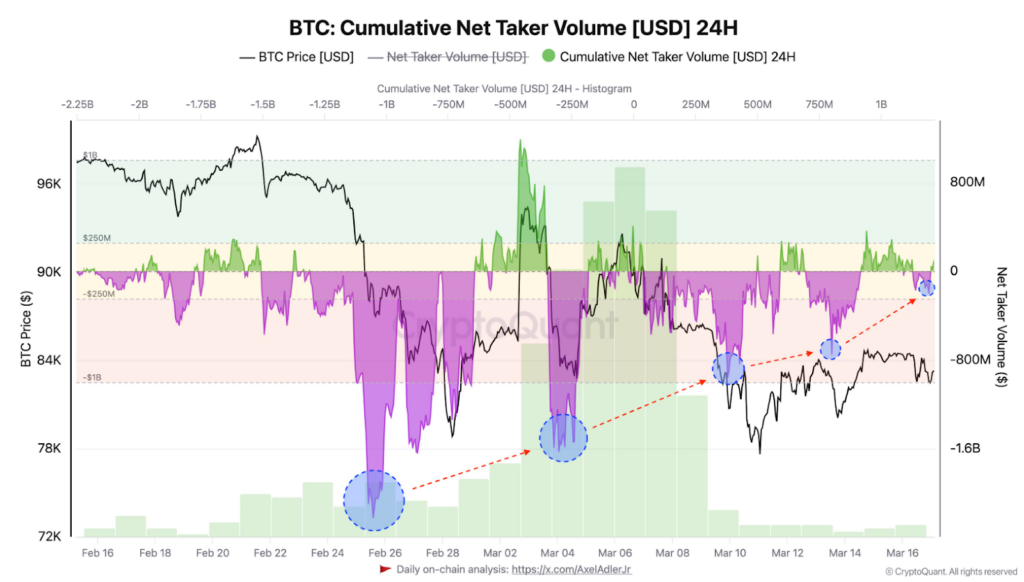
The number of traders who choose to short Bitcoin has decreased significantly since February 26, indicating bearish traders are losing their confidence.
The declining short-interest levels and falling funding rates establish conditions for sudden market movements.
Bitcoin News: Miners Cash Out—What’s Their Next Move?
The supply and demand dynamics of Bitcoin heavily depend on miners who actively participate in its network operations.
Large BTC sales from miners typically indicate profit-taking or downside protection strategies. Recently, data from CryptoQuant shows, Bitcoin miners achieved over $27 Million in profits.

The market reaction to this development remains ambiguous because it does not automatically indicate negative market conditions.
Historically, the market typically witnesses miner sell-offs as a precursor to major price increases. The same pattern occurred before both the 2017 and 2021 bull market runs.
Is 2017 Repeating? The Bullish Case
Meanwhile, the current Bitcoin price stands at an undervalued position according to Ethereum’s quarterly price data, which matches the March 2017 situation.
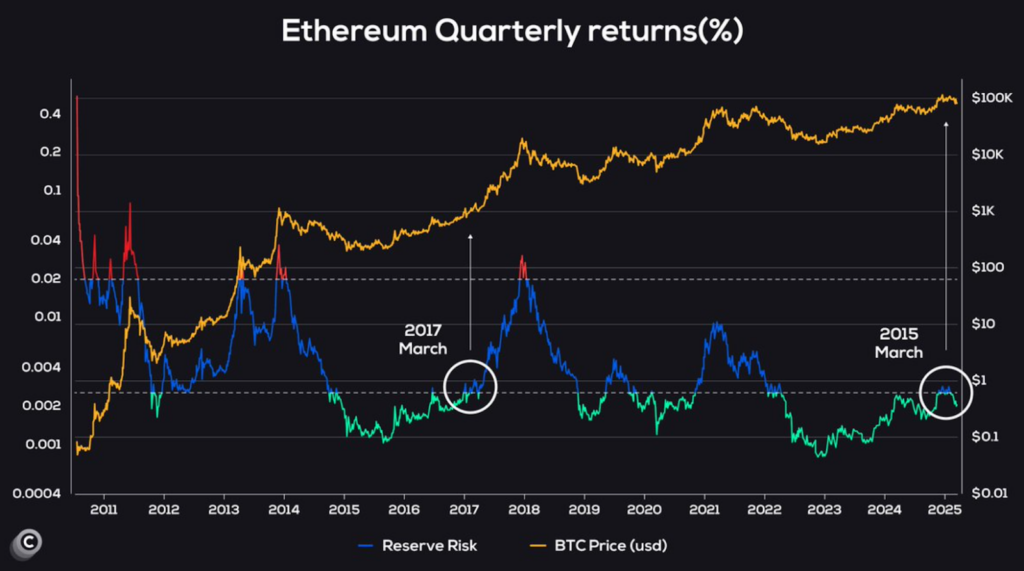
Back then, the token maintained a flat price movement until it launched into its most powerful price expansion, which reached fresh all-time highs during the last quarter of 2017.
Additionally, analysts predict another substantial price rally as the current market conditions mirror those from 2017. If this pattern holds, the ongoing Bitcoin pullback shows potential to become the foundation for a breakout.
Meanwhile, an analysis by CryptoCove demonstrates that the token is in a falling wedge pattern that represents a traditional bullish reversal formation, with a projection to reach $109K by mid-April.

If this plays out, a drop to $78K could serve as the initial phase for BTC to grab market liquidity before it breaks through resistance levels on its way to reaching six figures.