Ethereum price has recoiled in the past few weeks despite having some positive exchange-traded funds and staking inflows.
Ethereum (ETH) was trading at $3,400 on Dec. 29, down by over 17.2% from its highest level this month. This retreat occurred as Ethereum continued to see strong fundamentals.
Data by SoSoValue shows that the daily inflows jumped by $47.7 million on Friday. The funds have had inflows in the last four consecutive days with two days of outflows over the last 25 days.
The cumulative net inflows of these ETFs has moved to over $2.68 billion, bringing the total net assets to over $12.1 billion. The BlackRock Ethereum ETF has had the most inflows, which brought its total assets to $3.58 billion.
Grayscale, Fidelity, and Bitwise also offer ETH funds.
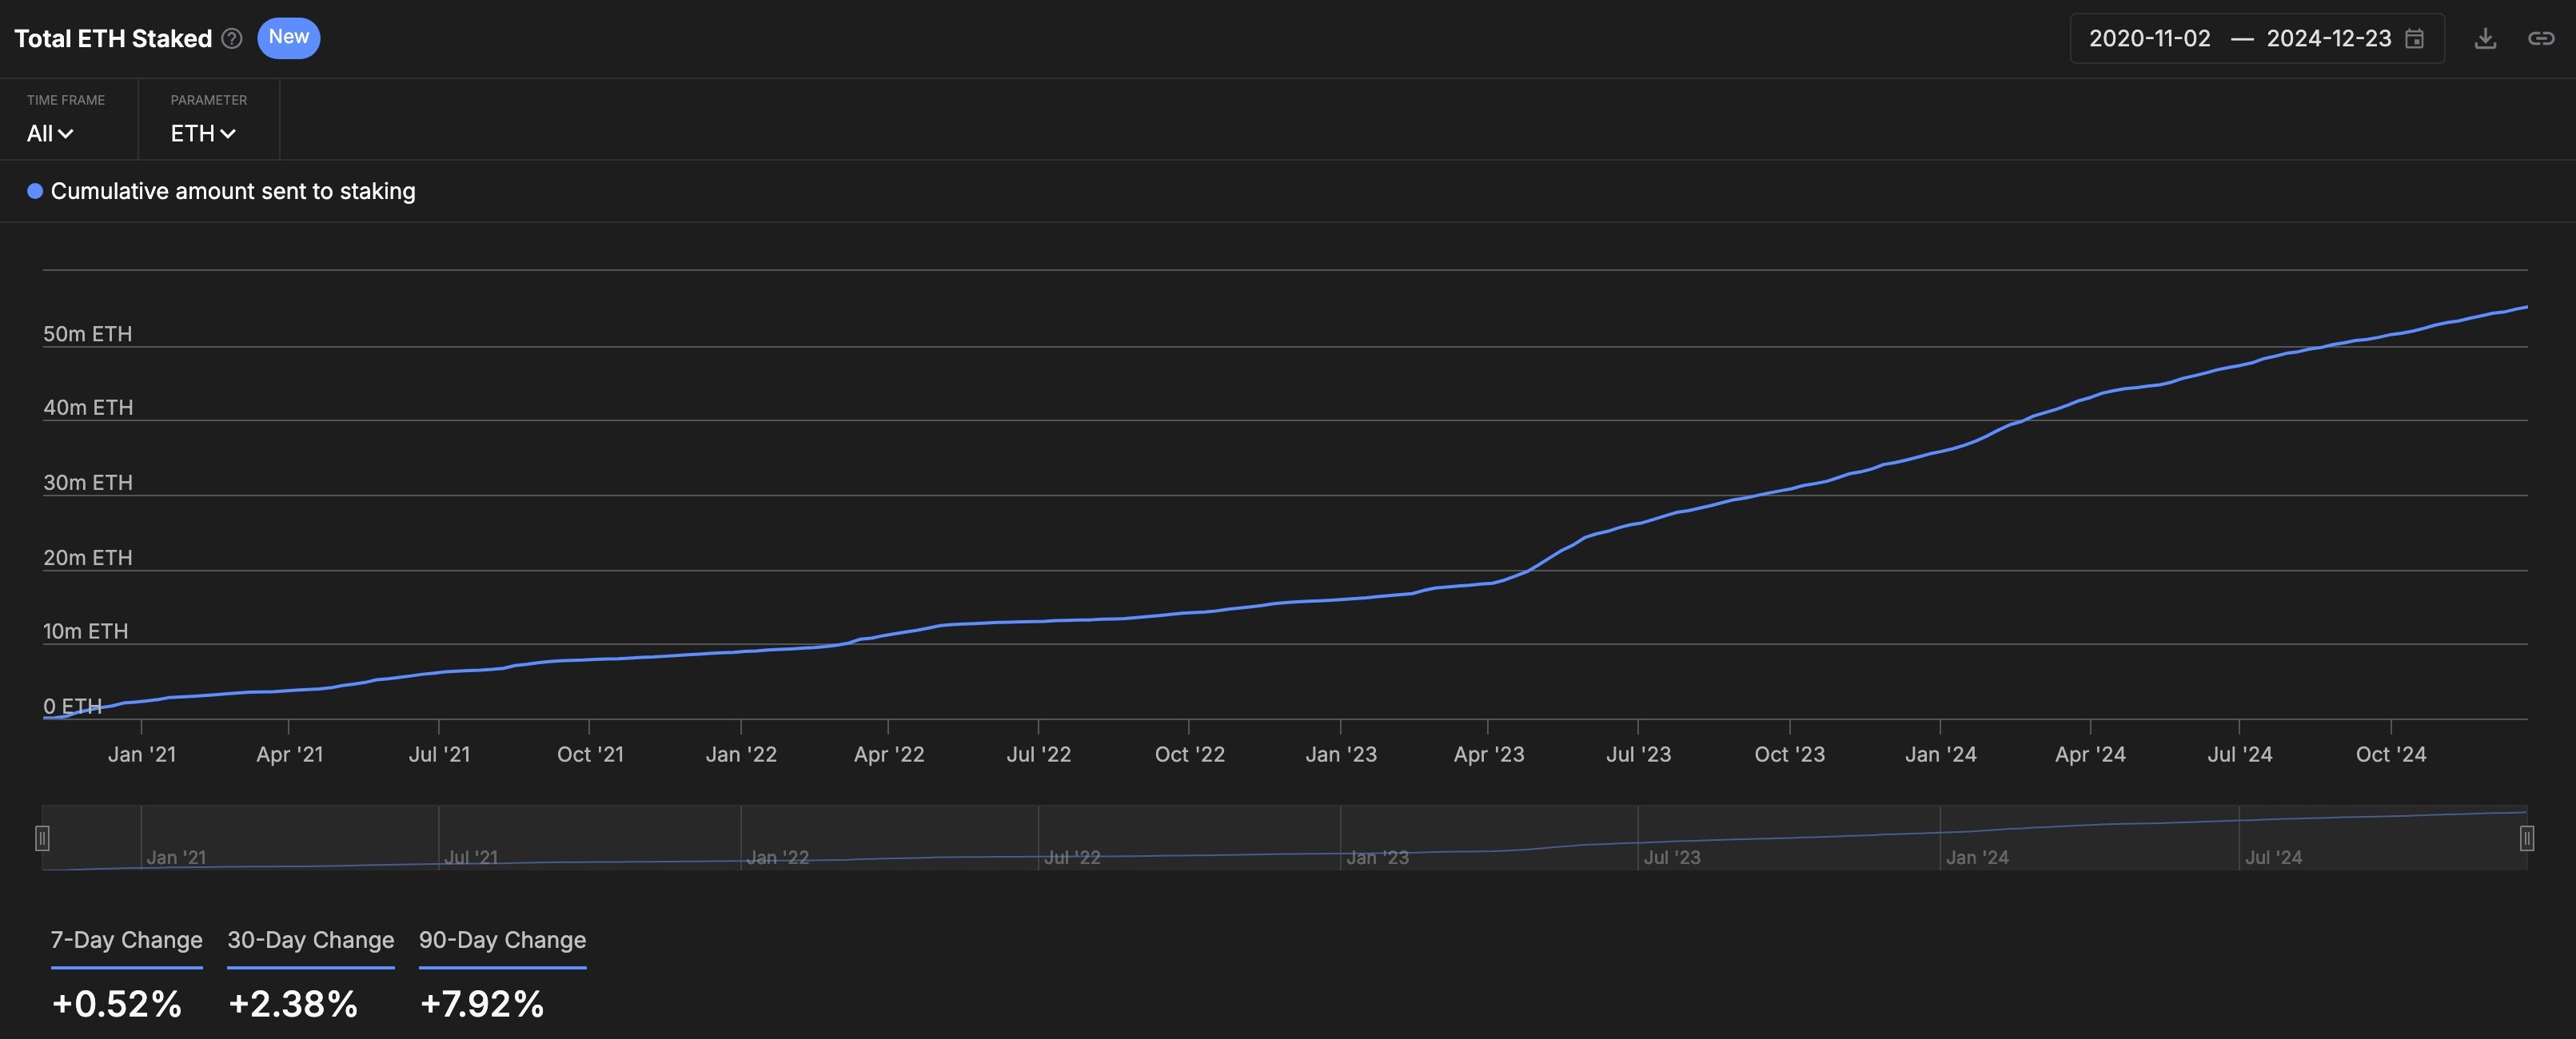
Meanwhile, data by IntoTheBlock shows that more investors are staking Ethereum. The cumulative ETH sent to staking rose to 55.18 million ETH. The staking market cap has risen to $114.95 billion, with the average reward rate being 3.06%.

Staking is a process where Ethereum holders delegate their tokens to secure the network. They are in turn paid using its fees, which have been in a slow uptrend in the past few years.
According to TokenTerminal, Ethereum generated over $2.4 billion in 2024, making it the second most profitable network in the industry after Tether.
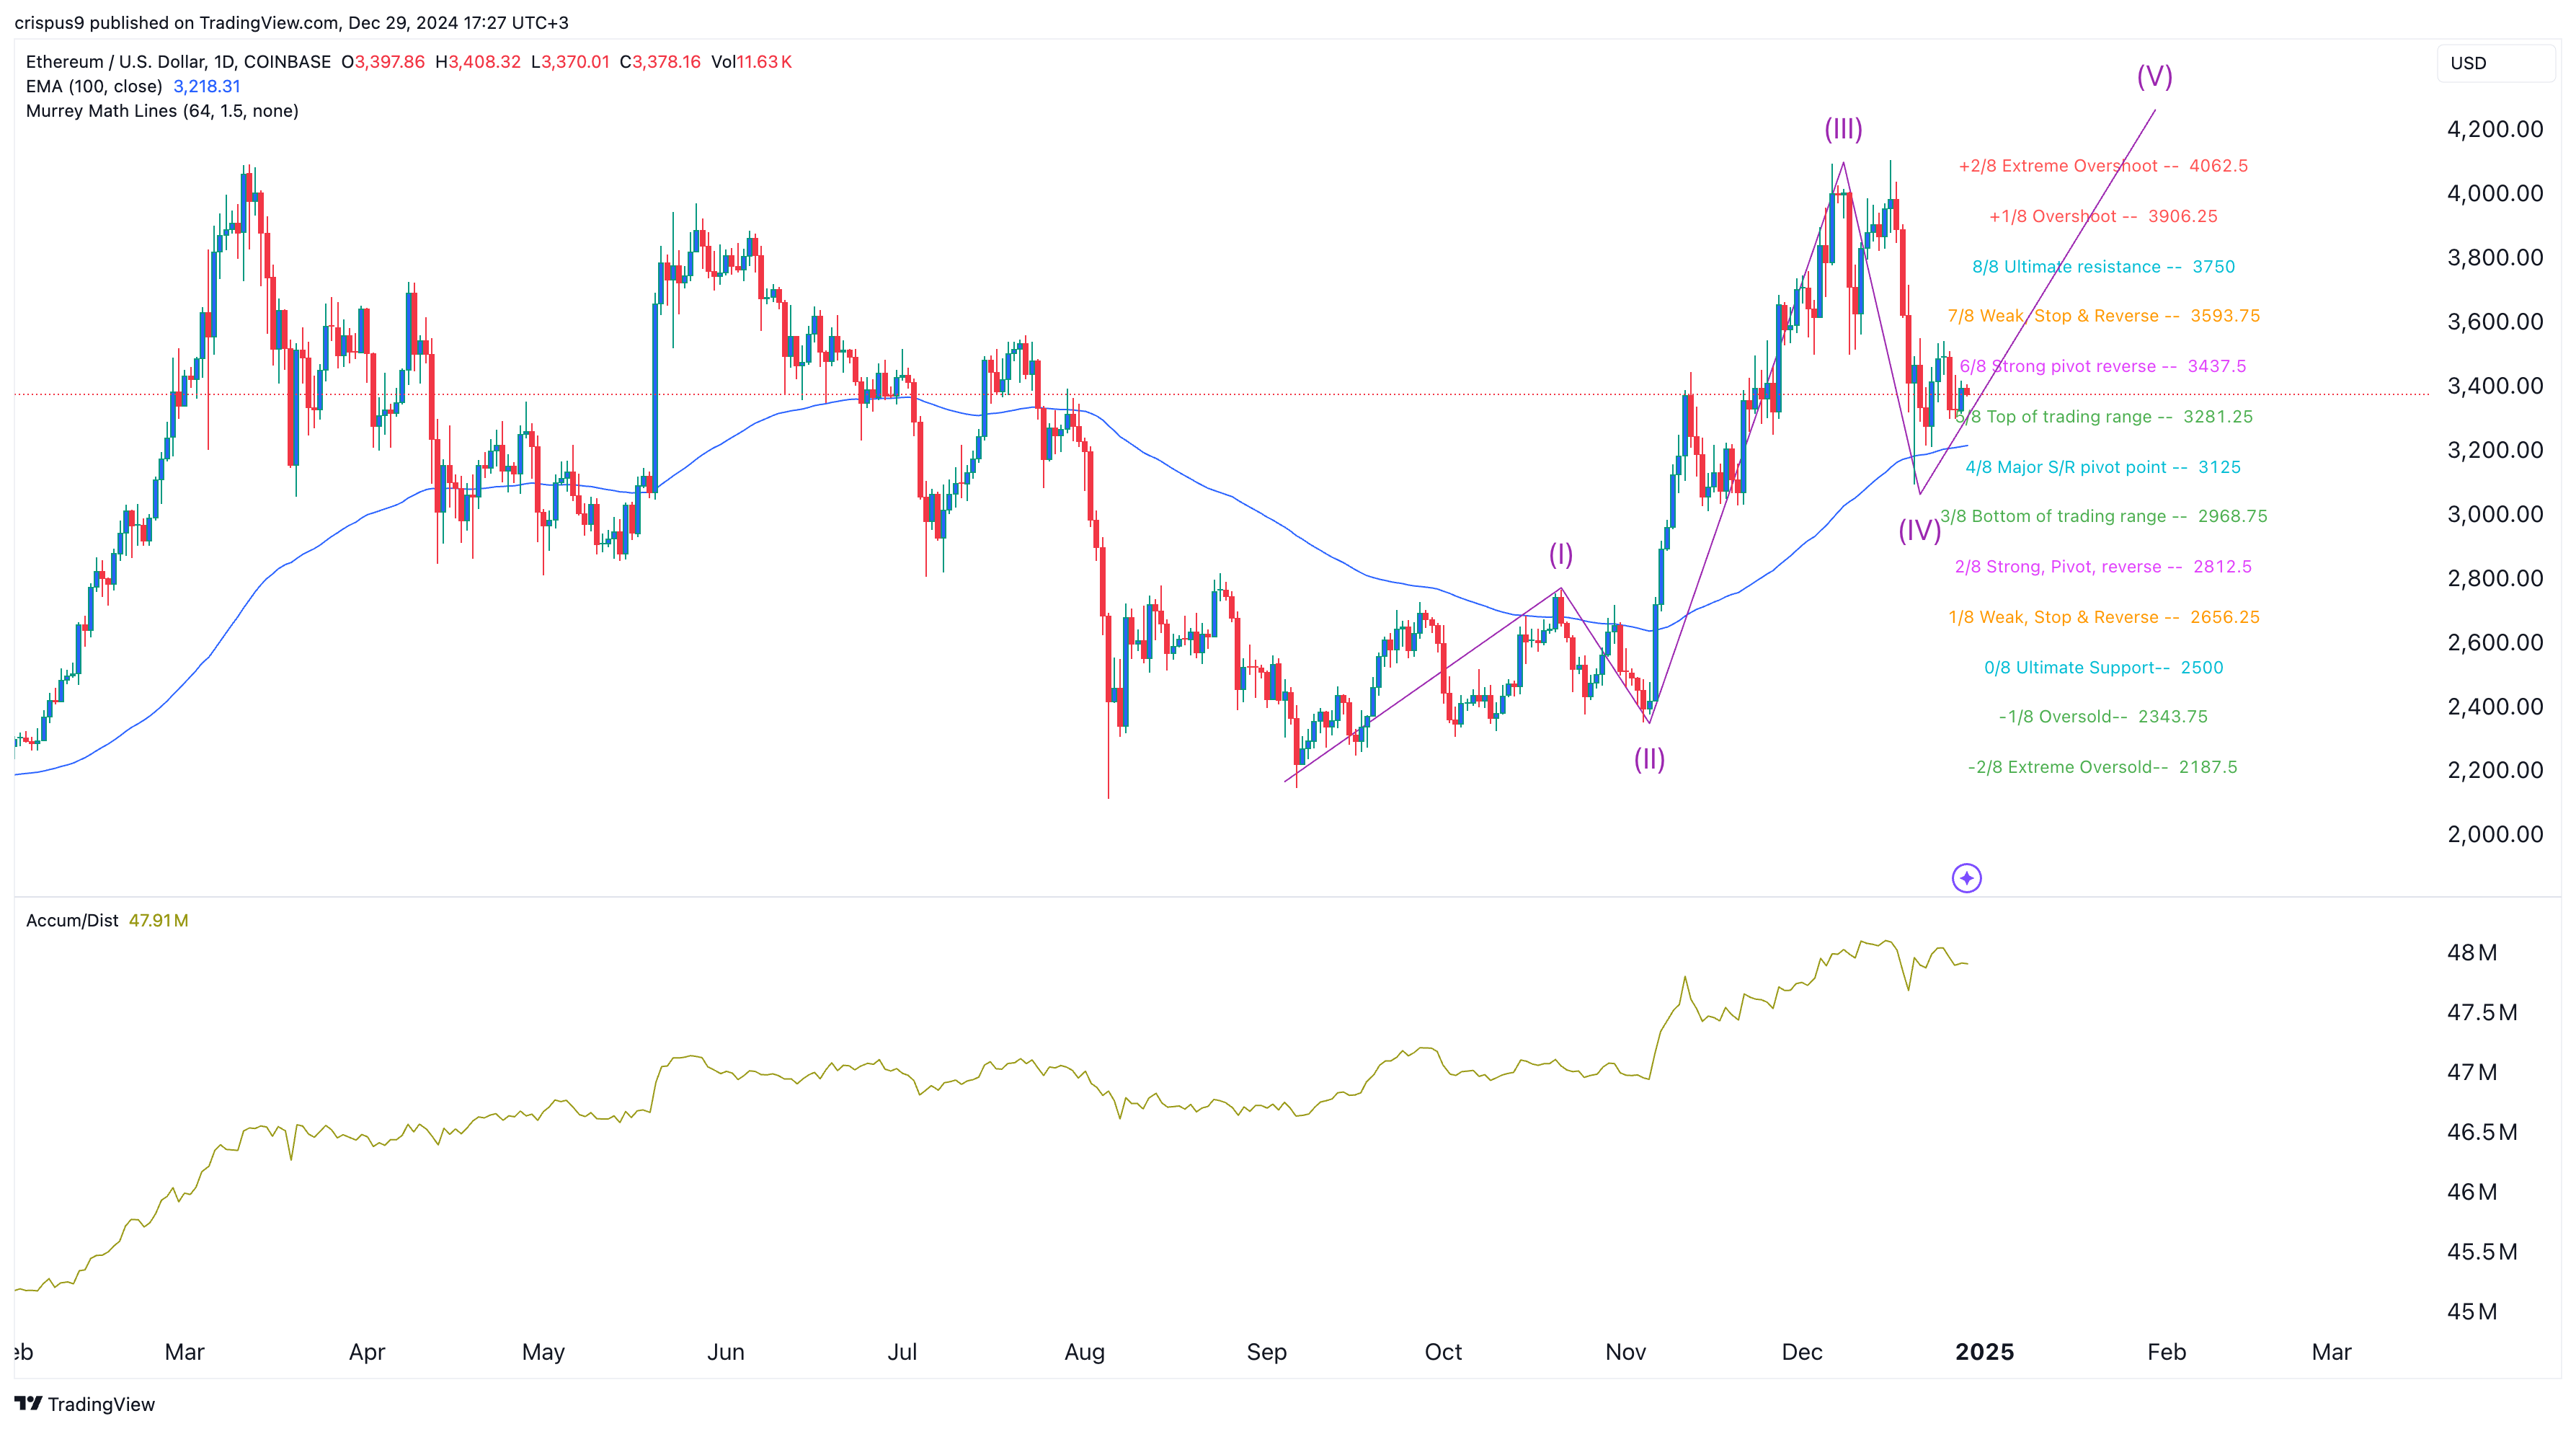
Some analysts are optimistic that Ethereum price could bounce back in the near term. In an X post, TMV, a highly followed pundit, predicted that the coin would rebound after completing the fourth section of the Elliot wave, a unique pattern that identifies five stages that assets go through.
The fourth wave is usually bearish, while the fifth tends to be bullish.
Ethereum price analysis

The daily chart shows that ETH price has retreated after finding substantial resistance at $4,000, the extreme overshoot of the Murrey Math Lines.
The coin has moved slightly below the strong pivot reverse point at $3,437. It has also remained above the 100-day moving average, while the accumulation/distribution indicator has risen — a sign that investors are buying.
Therefore, technicals, including the Elliot Wave pattern, could bounce back in the coming weeks. If this happens, the next target will be $3,750, the ultimate resistance point of the Murrey Math Lines.


