
Litecoin’s price just broke higher after moving sideways for a while. But trader Jip Molenaar and others are still being careful since the price hasn’t touched the recent low point yet. This means we might see prices dip before climbing further.
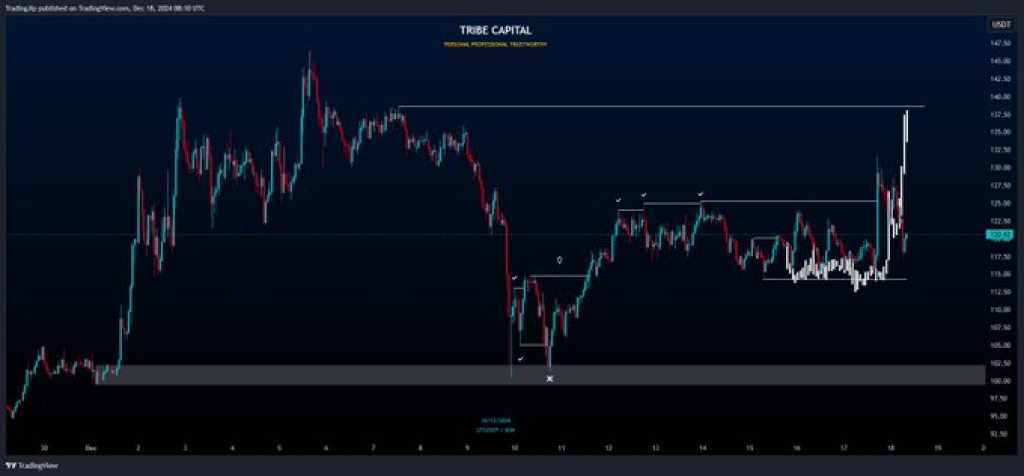
However, Litecoin’s chart indicates a significant move upward, breaking above prior resistance levels. The sharp pump occurred after a prolonged phase of sideways price movement, where LTC’s price traded within a narrow range between December 12 and December 18. The breakout pushed the price toward resistance levels around $122 and $140, showing clear bullish momentum.
Despite this, Jip Molenaar, a prominent analyst expressed reservations on X. He highlighted that the breakout happened “without sweeping the low.” This observation points to the untested liquidity at lower support levels near $69–$70. Molenaar emphasized that he is awaiting a retest of these levels before positioning himself for a long trade.


Support and Resistance Zones
The chart reveals a well-defined support zone near $69–$70, marked by a grey area where the LTC price previously stabilized. This region represents a potential accumulation area for buyers. However, the price has yet to revisit this level after the recent pump.
On the upside, resistance levels are evident at $122 and $140. The initial resistance at $122 coincides with a prior local high where price action faced rejection. The upper resistance near $140 marks the breakout target, aligning with Litecoin’s peak following the sudden rally.
The current price remains in a delicate position. While bulls have pushed LTC higher, failure to sustain the breakout could see a retracement back toward support levels.
Liquidity Concerns and Trading Strategies
Jip Molenaar’s cautious stance aligns with the concept of liquidity sweeps. A liquidity sweep occurs when prices dip below key support to trigger stop losses or collect liquidity before reversing higher. Since Litecoin has yet to test the support lows, some traders remain skeptical of the breakout’s sustainability.
Traders watching LTC may consider two scenarios: a potential retracement to sweep the lows or sustained bullish momentum above the breakout levels. If Litecoin’s price holds its breakout, it could pave the way for continued gains. However, a failure to hold above the recent range might validate the concerns of traders like Molenaar.
Read Also: Why Is Hedera (HBAR) Price Pumping?
Outlook for Litecoin Price Action
Litecoin’s recent price breakout is noteworthy, but untested liquidity below support raises the possibility of a pullback. For traders like Jip Molenaar, a sweep of the lows near $69–$70 remains a key signal for positioning long trades. Whether LTC revisits these levels or holds above resistance will determine its next move.
For now, the LTC price remains in a critical phase, with both upside continuation and retracement scenarios on the table. Traders are advised to monitor key support and resistance levels closely.
Follow us on X (Twitter), CoinMarketCap and Binance Square for more daily crypto updates.
Get all our future calls by joining our FREE Telegram group.
We recommend eToro
Active user community and social features like news feeds, chats for specific coins available for trading.
Wide range of assets: cryptocurrencies alongside other investment products such as stocks and ETFs.
Copy trading: allows users to copy the trades of leading traders, for free.
User-friendly: eToro’s web-based platform and mobile app are user-friendly and easy to navigate.
Source link


