to Chase Viral $0.175 Altcoin with a $30 Price Target")


As crypto continues to gain traction in the mainstream economy, its adoption is expanding beyond niche circles. A new survey from the asset management firm Bitwise confirms this narrative.
The survey offers insights into how US financial advisors are integrating crypto into client portfolios and planning for the future.
Crypto Becomes Mainstream: 56% of Advisors More Likely to Invest
The survey, conducted between November 14 and December 20, 2024, reveals a significant shift in financial advisors’ perceptions and actions toward cryptocurrency.
A surprising outcome of the 2024 US elections has been the marked increase in advisors’ enthusiasm for cryptocurrency. About 56% of surveyed advisors stated that the election results made them more likely to invest in crypto in 2025.
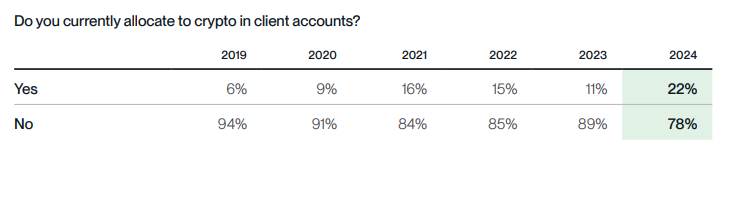
The number of advisors incorporating crypto into client portfolios has surged. In 2024, 22% of advisors reported allocating to crypto in client accounts, a dramatic increase from just 11% in 2023.
According to the survey, the demand for crypto among clients is stronger than ever. Also, 96% of advisors reported receiving questions about cryptocurrency from their clients in 2024.
Among advisors already investing in crypto, 99% plan to either maintain or increase their crypto allocations in 2025.
“If you had any doubt that 2024 was a massive inflection point for crypto, this year’s survey dispels it. Advisors are awakening to crypto’s potential like never before, and they’re allocating like never before. But perhaps most staggering is how much room we still have to run, with two-thirds of all financial advisors—who advise millions of Americans and manage trillions in assets—still unable to access crypto for clients,” Bitwise CIO Matt Hougan noted.
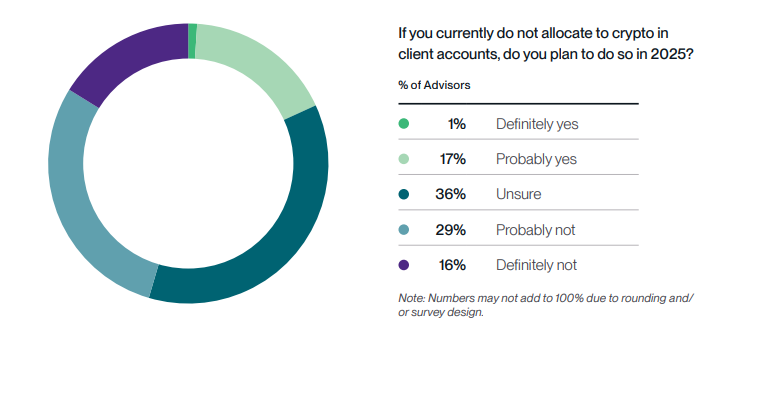
Moreover, 19% of advisors who had previously avoided crypto exposure said they are now “definitely” or “probably” planning to invest in crypto assets for clients. This marks a notable increase from 8% in 2024.
Yet, despite the growing adoption of crypto, access remains a challenge. Only 35% of advisors can purchase crypto directly in client accounts, highlighting a barrier to wider adoption.
Looking ahead to 2025, crypto equity ETFs remain the most favored vehicle for exposure to crypto. This preference reflects the growing interest in investment products that provide exposure to the crypto market rather than individual cryptocurrencies.
While concerns around regulatory uncertainty remain, they have somewhat diminished compared to previous years. In 2024, 50% of advisors cited regulatory challenges as a major obstacle, down from 60-65% in earlier surveys, suggesting that clarity is improving.
Additionally, Bitwise surveyed 400 financial advisors, including independent registered investment advisors, broker-dealer representatives, financial planners, and wirehouse representatives from across the US.
Disclaimer
In adherence to the Trust Project guidelines, BeInCrypto is committed to unbiased, transparent reporting. This news article aims to provide accurate, timely information. However, readers are advised to verify facts independently and consult with a professional before making any decisions based on this content. Please note that our Terms and Conditions, Privacy Policy, and Disclaimers have been updated.