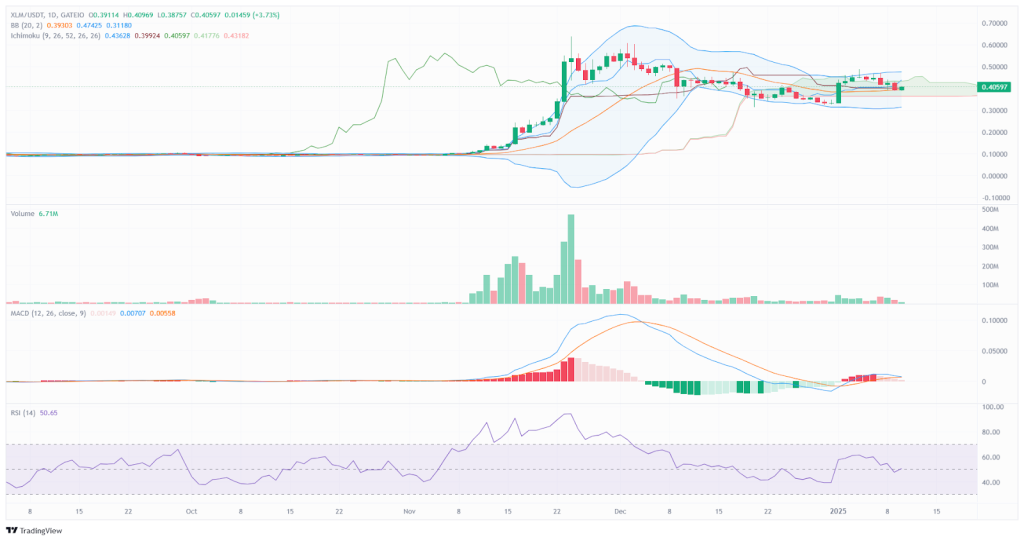

Stellar (XLM) is showing signs of an imminent breakout despite its ongoing consolidation phase. An analysis of the daily chart on TradingView indicates mounting pressure for a decisive price move. Supporting data from CoinGlass reinforces this technical setup, suggesting XLM has reached a critical decision point.
Stellar Price Analysis Shows Signs of Consolidation
On TradingView’s daily XLM/USDT chart, the price is holding steady around $0.40597, rebounding from December lows.
The Bollinger Bands have narrowed, a technical signal often associated with reduced volatility and potential breakout scenarios. The Ichimoku Cloud shows XLM trading near equilibrium, reinforcing the current consolidation phase.


Technical indicators provide mixed signals. The MACD shows weak bullish momentum, with the line barely crossing above the signal. The RSI, at 50.65, suggests neutral market conditions, neither overbought nor oversold. A drop in trading volume further points to market indecision, often a precursor to significant price movements.
Liquidations Highlight Market Volatility
The XLM Total Liquidations Chart paints a picture of heightened market activity, especially during key dates in December.


A sell-off on December 9 triggered long position liquidations, while December 31 saw the opposite – shorts were caught off guard as prices rallied. Moving into January, liquidation activity has moderated, though brief spikes continue as prices fluctuate. This pattern suggests traders are now quick to adjust their positions even on minor price movements.
These liquidation spikes underline the risks of high leverage trading. Traders using excessive leverage often amplify market volatility, leading to sudden price swings. Market participants should exercise caution during such periods and focus on managing risk effectively.
XLM Funding Rates Signal Bullish Bias
CoinGlass data on XLM’s funding rate history shows a prevailing bullish sentiment in the derivatives market.


Positive funding rates have dominated since late November, with the largest spikes occurring during price rallies in early December. These indicate strong long positions among traders, though occasional negative rates hint at moments of bearish correction. The funding rates for XLM in January have shown a consistent fluctuation between slightly positive and negative values, reflecting a balance between bullish and bearish sentiment.
However, sustained high funding rates can create unsustainable upward pressure, increasing the likelihood of a correction. Traders should keep an eye on these rates, as sudden shifts in sentiment could lead to rapid market reversals.
Read also: XRP and Cardano Show Growth, But This Altcoin Is Losing Holders
Critical Levels and What’s Next
Two critical levels have emerged for XLM: $0.380 as support and $0.450 as resistance. A move above $0.450 could signal bullish momentum, potentially drawing increased market interest.
Conversely, a decline below $0.380 might trigger further downward pressure, particularly in the current fragile market environment. With narrowing Bollinger Bands and mixed signals across indicators, XLM’s price is poised for a decisive move.
Follow us on X (Twitter), CoinMarketCap and Binance Square for more daily crypto updates.
Get all our future calls by joining our FREE Telegram group.
We recommend eToro
Active user community and social features like news feeds, chats for specific coins available for trading.
Wide range of assets: cryptocurrencies alongside other investment products such as stocks and ETFs.
Copy trading: allows users to copy the trades of leading traders, for free.
User-friendly: eToro’s web-based platform and mobile app are user-friendly and easy to navigate.
Source link


