Key takeaways
- The average Fantom price prediction in 2025 is $2.98.
- Holders can anticipate a maximum price of $5.78 in 2028.
- By 2030, FTM might touch $9.32.
Fantom (FTM) is a high-performance blockchain platform designed for decentralized applications (dApps) and smart contracts. Launched in June 2018 by Dr. Ahn Byung Ik and Matthew Hur, Fantom employs a unique consensus mechanism called Lachesis, which utilizes asynchronous Byzantine fault tolerance (aBFT) to achieve rapid transaction processing speeds of up to 300,000 transactions per second while maintaining security and decentralization.
The platform operates on the Fantom Opera blockchain, which is Ethereum Virtual Machine (EVM)-compatible, allowing it to run existing Ethereum smart contracts and develop new ones. This interoperability is enhanced by Fantom’s modular architecture, where each dApp can operate on its own blockchain network, ensuring that performance is not affected by congestion in other areas of the network.
Fantom’s native token, FTM, serves multiple purposes, including transaction fees, staking for network security, and governance rights within the ecosystem. The platform is recognized for its scalability, low transaction costs, and energy efficiency, making it an attractive option for developers looking to build decentralized finance (DeFi) applications.
Overview
| Cryptocurrency | Fantom |
| Token | FTM |
| Price | $0.9766 |
| Market Cap | $2.73B |
| Trading Volume | $391.57M |
| Circulating Supply | 2.8B FTM |
| All-time High | $3.48 on Oct 28, 2021 |
| All-time Low | $0.001953 on March 13, 2020 |
| 24-h High | $1.03 |
| 24-h Low | $0.9341 |
Fantom price prediction: Technical analysis
| Volatility | 14.47% |
| 50-Day SMA | $ 0.957191 |
| 14-Day RSI | 41.97 |
| Green Day | 16/30 (53%) |
| Sentiment | Bearish |
| Fear & Greed Index | 73 ( Greed) |
| 200-Day SMA | $ 0.65014 |
Fantom price analysis
TL;DR Breakdown:
- FTM price analysis confirmed a bearish trend
- Fantom is facing resistance at $1.5 and support at $0.9
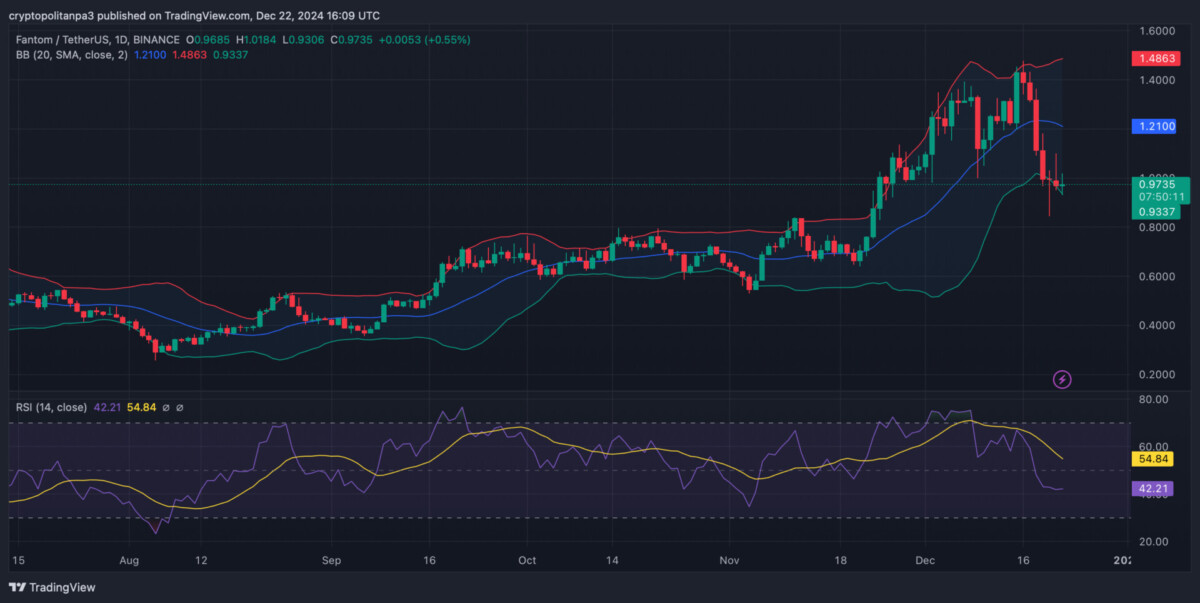
Fantom price analysis 1-day chart

On December 22, the 1-day chart for Fantom (FTM/USDT) demonstrates notable volatility. The Bollinger Bands are widening, indicating increased price fluctuations. The current price hovers around $0.9735, with resistance at $1.4863 (upper band) and support at $0.9337 (lower band). The 20-day simple moving average (SMA) at $1.2100 is an additional resistance level. The RSI stands at 42.21, reflecting bearish momentum, and indicating oversold territory. Recent red candlesticks suggest selling pressure, but the slight recovery in the last session (+0.55%) signals potential stabilization. A sustained move above $1.00 could shift the trend, while a dip below $0.90 would confirm further bearishness.
FTM/USD technical analysis 4-hour chart

The 4-hour chart for Fantom (FTM/USDT) illustrates a bearish bias, with the price at $0.9759, down by 0.29%. The Balance of Power (BoP) indicator shows a value of -0.34, confirming selling pressure. The MACD suggests weakening momentum, with the signal line at -0.0613 and the MACD line at -0.0529, though a potential bullish crossover is developing. Immediate resistance lies at $1.00, while support is found at $0.97. The price remains below key psychological levels, indicating hesitation among buyers. A sustained break above $1.00 may trigger bullish momentum, while a dip below $0.95 could exacerbate bearish dominance in the short term.
Fantom technical indicators: Levels and action
Daily simple moving average (SMA)
| Period | Value | Action |
| SMA 3 | $ 1.219498 | SELL |
| SMA 5 | $ 1.211725 | SELL |
| SMA 10 | $ 1.226484 | SELL |
| SMA 21 | $ 1.221443 | SELL |
| SMA 50 | $ 0.957191 | BUY |
| SMA 100 | $ 0.807689 | BUY |
| SMA 200 | $ 0.65014 | BUY |
Daily exponential moving average (EMA)
| Period | Value | Action |
| EMA 3 | $1.191557 | SELL |
| EMA 5 | $1.228311 | SELL |
| EMA 10 | $1.243032 | SELL |
| EMA 21 | $1.18802 | SELL |
| EMA 50 | $1.022397 | SELL |
| EMA 100 | $0.865594 | BUY |
| EMA 200 | $0.738788 | BUY |
What can you expect from the FTM price analysis next?
Based on both 1-day chart and 4-hour chart reveals bearish momentum with mixed signals of potential stabilization. On the 1-day chart, the RSI at 42.21 indicates bearish momentum nearing oversold conditions, while Bollinger Bands suggest volatility with key resistance at $1.4863 and support at $0.9337. The 4-hour chart’s MACD hints at potential recovery, though selling pressure persists with the Balance of Power at -0.34. If Fantom surpasses the psychological resistance at $1.00, bullish momentum could follow. Conversely, a decline below $0.95 may trigger further bearish pressure. Traders should monitor volume and momentum indicators closely for directional confirmation in the short term.
Is Fantom a good investment?
Fantom is a high-speed, scalable blockchain platform gaining attention as an alternative to networks like Ethereum. Based on our analysis, we are optimistic about its growth, projecting a price of $2.71–$3.27 by 2025 and $8.51–$9.32 by 2030. Despite its potential, investing in Fantom involves risks typical of cryptocurrencies, including market volatility. Own research and an assessment of personal risk tolerance are essential steps for anyone considering Fantom as a potential investment opportunity
Will Fantom reach $5?
Fantom (FTM) could potentially reach $5 by 2027, with price predictions suggesting a high of $5.78. However, achieving this depends on market conditions and overall blockchain adoption trends.
Will Fantom reach $10?
Based on our technical analysis, Fantom (FTM) has the potential to approach double-digit prices within the next 6 years. Notably, Fantom reached its all-time high of $3.48 in late October 2021. Our recent Fantom predictions suggest that by 2030, Fantom could attain a price of $9.32.
Is Fantom a safe network?
As of October 2023, Fantom is regarded as a secure blockchain platform that utilizes its unique Lachesis consensus mechanism for high-speed and scalable transactions. However, as with any blockchain network, users should exercise caution, use official channels, and follow best security practices to protect their assets.
Does Fantom have a good long-term future?
Fantom (FTM) shows potential for a strong long-term future, with price predictions suggesting significant growth by 2030 and beyond. Analysts forecast prices could reach between $8.51 and $9.32, driven by its unique blockchain technology and increasing adoption in decentralized applications. However, market volatility remains a concern.
Recent news/opinion on Fantom
@VicunaFinance shines as Sonic Labs’ Emerald Tier Boom Winner, revolutionizing leveraged lending on Fantom.
Fantom annonced that @Gravity_Finance rises to Emerald Tier on Sonic Labs, offering Fantom investors effortless, customizable strategies with strong profit and risk protection.
Fantom price prediction December 2024
The Fantom price is likely to remain stable throughout December. It is currently trading at $1.26, which is speculated to be the average monthly price.
| Period | Potential Low ($) | Average Price ($) | Potential High ($) |
| Fantom price prediction December 2024 | $1.26 | $1.26 | $1.26 |
Fantom price prediction 2024
By 2024, Fantom’s average market price is expected to be $2.67, with a potential low of $1.13 and a potential high of $2.77.
| Period | Potential Low ($) | Average Price ($) | Potential High ($) |
| Fantom Price Prediction 2024 | $1.13 | $2.67 | $2.77 |
Fantom price forecast 2025 – 2030
| Year | Potential Low ($) | Average Price ($) | Potential High ($) |
| 2025 | $2.71 | $2.98 | $3.27 |
| 2026 | $3.71 | $4.36 | $4.55 |
| 2027 | $4.82 | $5.40 | $5.78 |
| 2028 | $4.82 | $5.40 | $5.78 |
| 2029 | $5.99 | $6.43 | $6.80 |
| 2030 | $8.51 | $9.08 | $9.32 |
Fantom Price Prediction 2025
Fantom network is expected to continue its upward trend in 2025, potentially reaching an all-time high of $3.27. However, there could be fluctuations, and the FTM coin price might dip to $2.71, with an average price of around $2.98.
Fantom price prediction 2026
In 2026, Fantom market price is expected to peak at $4.55. However, it might fall to $3.71, with an average of $4.36.
Fantom price prediction 2027
The Fantom forecast for 2027 speculates that the price might hit a new all-time high of $5.78 by 2027. On the lower end, corrections may pull the price to $4.82, with an expected average trading price of around $5.40.
Fantom Price Prediction 2028
In 2028, Fantom’s market price might stabilize at $5.78 while maintaining the same average trading price of around $5.40 and minimum price of around $4.82, the same as in 2027.
Fantom price prediction 2029
Fantom is expected to reach a maximum of $6.80 by 2029. However, it could fall to $5.99, with an average price of $6.43.
Fantom Price Prediction 2030
In 2030, Fantom is projected to hit a high of $9.32. In the event of a price correction, it could drop to $8.51, with an average of $9.08.

Fantom market price prediction: Analysts’ FTM price forecast
| Firm Name | 2024 | 2025 |
| Coincodex | $1.559 | $3.26 |
| Binance | $1.013 | $ 1.064 |
Cryptopolitan’s Fantom (FTM) price prediction
At Cryptopolitan, we predict Fantom (FTM) to reach $2.77 by the end of 2024, averaging $2.67. By 2026, FTM could hit $4.55 due to increasing adoption, strong developer support, and favorable market conditions.
Fantom (FTM) historic price sentiment

- Fantom (FTM) launched its mainnet in December, with initial trading prices mostly below $0.02 in 2019.
- FTM experienced gradual growth, staying under $0.05 for most of 2020 but reaching around $0.017 to $0.02 by December due to growing DeFi interest.
- Prices surged from $0.02 in January 2021 to $3.48 by October, driven by DeFi adoption and positive market sentiment. The year ended with a correction to around $2.30.
- In 2022, FTM faced significant fluctuations due to macroeconomic factors, with prices dipping below $0.50 mid-year. Despite recovery attempts, bearish trends dominated.
- Early volatility in 2023 saw prices around $0.40, recovering to $0.55 mid-year before settling between $0.45 and $0.50 by year-end.
- In early 2024, FTM surged from around $0.31 in January to above $1.00 by March, driven by strong bullish momentum and increased trading volumes. After peaking in March, the price corrected, dropping to lower highs and lows by April.
- Following the correction, FTM found support around $0.60 in May and entered a consolidation phase between $0.50 and $0.80 in June. Despite volatility and tests of the $0.50 support, it held firm.
- Fantom declined a bit in August, reaching low levels. Fantom reached $0.42 by Aug 28. Currently, in September, FTM traders around $0.4208
- On October 02, the price of FTM reached $0.6511 with $365.52M 24-hour trading volume.
- On November 3, Fantom (FTM) experienced a price drop to $0.60. By December 4, Fantom rise to $1.2164, accompanied by a substantial trading volume of $820.76 million, indicating a significant rebound in market activity


