The 2024 Bitcoin price candle closed at $93,542.69, reflecting significant bullish momentum compared to previous years.
The 2025 BTC candle opened with optimism, marking a continuation of upward movement after a steady growth pattern observed since 2015.
Historically, Bitcoin prices showcased consistent increases, reaching critical thresholds like $24,000 in 2020 and $44,000 in 2021.
This steady growth was interrupted briefly in 2022 but resumed with momentum in subsequent years.

The chart reflects strong investor confidence and a rising trend in cryptocurrency adoption.
Predictions suggest BTC could breach the $100,000 milestone in 2025 if current trends persist.
– Advertisement –
BTC markets’ resilience and transformative potential in the global financial ecosystem.
Bitcoin Addresses Holding 1+ BTC Drop
In the past two months, addresses holding more than 1 BTC declined by 18,530, reflecting decreased accumulation.
This drop began in November, correlating with BTC price fluctuations between $40K and $80K.
Despite this, BTC’s overall price remained relatively stable after mid-December, holding a range above $40K.

BTC also reported a significant increase in transaction volumes, reflecting rising network activity and potential price impacts.
The decline in BTC addresses could suggest redistributions among investors, while TRON’s surge hinted at diversification.
BTC price activity stabilized after a volatile November, suggesting cautious optimism among traders.
$42 Billion BTC Profits Realized in One Month
The Bitcoin sell-side risk ratio spiked notably in November and December, coinciding with aggressive long-term holder sell-offs.
Over $42 billion in realized profits marked heightened market activity, with 1.23 million BTC worth $115 billion sold since November 5.
During this period, realized profits (green line) reached peaks near $12 billion, reflecting significant profit-taking amidst market volatility.
The sell-side risk ratio (orange line) climbed sharply, approaching 0.6%, signaling elevated selling pressure from key market participants.

Bitcoin’s price traded near $80,000 in early November but experienced fluctuations due to profit realization and long-term holder activity.
Realized losses remained relatively low, suggesting disciplined selling rather than panic-driven exits.
The realized cap stabilized at $8 Billion, indicating steady market valuation despite high selling pressure.
Future trends could see continued sell-offs if profits persist, possibly affecting price stability.
This period underscored significant profit realization and market activity.
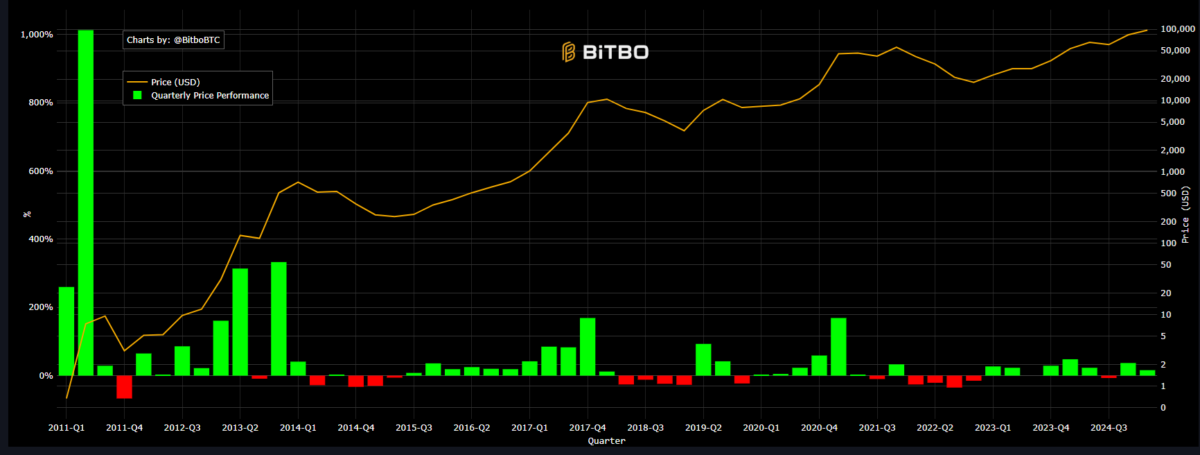
Bitcoin Price: Returns 2010 to 2024 Q4
Bitcoin’s returns from 2010 to Q4 2024 revealed cyclical growth patterns, marked by exponential gains followed by sharp corrections.
Early returns in 2010 demonstrated significant growth from negligible prices to a notable rally in 2013, peaking at around $1,000.
Subsequent years, particularly 2014, recorded negative returns due to prolonged bearish conditions, consistent with market cycles.
In 2017, Bitcoin surged to approximately $20,000 before retracing in 2018, confirming a cyclical pattern of extreme gains followed by corrections.

By 2021, Bitcoin reached an all-time high of $69,000, reflecting a strong bull market supported by institutional adoption and increased retail demand.
In 2022, bearish trends reduced returns significantly as global economic conditions weakened.
The 2024 data indicated a recovery with annualized returns exceeding previous years’ corrections, possibly driven by favorable halving cycles.
Predictions for Q4 2025 suggest further gains, as historical data aligns with previous bull market peaks. Analysts anticipate resistance near $100,000, with cyclical trends influencing future returns.
These fluctuations highlighted Bitcoin’s volatile yet high-performing historical return profile over the analyzed period.


