, Experts Predict 10x Multiple By Q3")

 CaryptosHeadlines Media Has Launched Its Native Token CHT.
Airdrop Is Live For Everyone, Claim Instant 5000 CHT Tokens Worth Of $50 USDT.
Join the Airdrop at the official website,
CryptosHeadlinesToken.com
CaryptosHeadlines Media Has Launched Its Native Token CHT.
Airdrop Is Live For Everyone, Claim Instant 5000 CHT Tokens Worth Of $50 USDT.
Join the Airdrop at the official website,
CryptosHeadlinesToken.com
Bitcoin price is testing a widely-watched technical setup dubbed the “Trinity Bottom,” with traders debating whether the current move will spark a fresh leg higher or signal an impending crash.
While sentiment remains muted, data shows capital is flowing back into crypto at an aggressive pace.
The leading cryptocurrency traded near $83,500 on April 5, up from intraday lows of $81,300 earlier this week.
Yet traders remain split over whether the market has found a sustainable floor.
Trinity Pattern Flashes For Bitcoin Price—Again
In a post on X, trader Merlijn described the return of the “Holy Trinity Bottom,” a recurring three-phase setup seen before 81% average Bitcoin price rallies.
The pattern, which has triggered twice since 2023, appeared again this week.

“It just triggered again,” Merlijn noted, suggesting the setup could pave the way for an upside breakout.
The chart showed Bitcoin price rebounding strongly after each previous signal, with the current setup showing potential for a move toward six figures.
However, the market context surrounding this signal appears more fragile than in past instances.
Capital Inflows Spike 350% in Two Weeks
Analyst Ali pointed out that capital inflows into crypto markets surged 350% in the last two weeks—from $1.82 billion to $8.20 billion.
The jump comes despite ongoing weakness in investor sentiment and exchange activity.

In a separate post, Ali also flagged that Bitcoin’s exchange-related activity has slowed, a trend that typically reflects reduced interest or consolidation phases, adding,
“Watching closely for a shift in trend.”
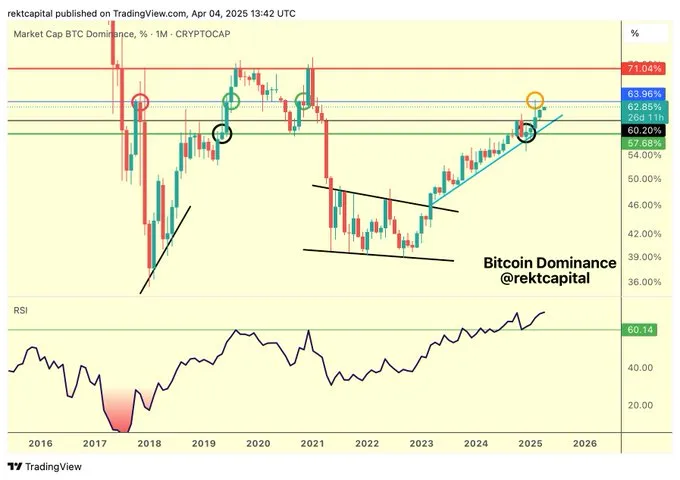
Meanwhile, Bitcoin dominance on the Relative Strength Index (RSI) has climbed toward all-time highs, according to trader Rekt Capital.
This suggests Bitcoin remains the preferred asset in the crypto market despite broader uncertainty.
Sentiment Hits Multi-Year Lows Despite Price Resilience
CryptoQuant’s “Bull Score Index” showed investor sentiment for Bitcoin price has slumped to its lowest levels since Jan. 2023.
The score dropped below 40 in Feb. 2025—a level associated with bear markets—after holding above that threshold throughout 2024.

However, Bitcoin’s resilience compared to U.S. equities paints a more complex picture. On April 3, Bitcoin closed with a green daily candle, even as the S&P 500 plunged 4.5%.
The divergence marked the first time since 2021 that Bitcoin decoupled meaningfully from traditional markets during a sell-off.
The following day, U.S. indexes extended losses—S&P down 3.87% and Dow Jones down 3.44%—while Bitcoin price held near breakeven, avoiding the steep capitulation seen in equities.
$70K Still in Sight as Practical Bottom, Says Peterson
Economist Timothy Peterson warned that Bitcoin price still faces short-term downside, potentially retesting the $70,000 level.
His Lowest Price Forward (LPF) model, which previously identified major bottoms, currently shows BTC tracking along the 75th percentile of bear market data.

“Bitcoin to $70k in 10 days?” Peterson queried in his April 4 post, suggesting this may be Bitcoin’s “practical bottom.” His model’s past predictions have held, including the mid-2020 $10,000 floor.
Yet, despite elevated fear, price action remains firm.
“Panic is elevated, but price is holding. That’s often what a bottom looks like,” Glassnode said in a thread discussing options market behavior.
Their data revealed a spike in demand for downside protection, mirroring levels last seen in mid-2023.

Risk-On Signals Return Amid Broader Market Pain
CryptoQuant’s “Value Days Destroyed” (VDD) metric dropped to 0.65 this week, suggesting a cooling-off phase following high profit-taking in late 2024. Historically, low VDD readings have preceded renewed accumulation phases.

“The market may be in transition,” the report said, pointing to a potential “risk-on” shift. Long-term holders appear less eager to sell, even amid broader financial volatility and geopolitical trade tensions.
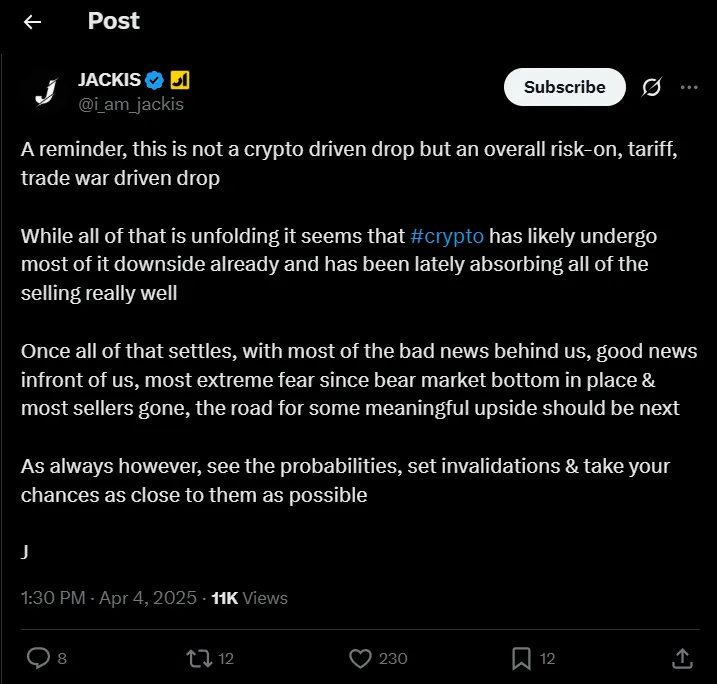
Trader Jackis framed the current phase as part of a broader macro decoupling. According to him,
“This is not a crypto-driven drop but a risk-on, trade war-driven shift…Crypto may have absorbed most of its downside already.”
Bitcoin Price at Crossroads—Bottom or Bull Setup?
Bitcoin sits at a technical crossroads. The return of the Trinity Bottom, combined with rising inflows and macro divergence, presents a case for cautious optimism.
Yet, with bearish pricing models and weak sentiment metrics still flashing, bulls must navigate carefully.
If history holds, Bitcoin price could rally sharply. But failure to defend current levels risks validating the $70,000 retracement zone.

As Altcoin Sherpa noted, “$BTC squiggly was correct… I think we’re going to those 89ks soon.”
The coming days may decide whether the pattern plays out—or breaks down.