 CaryptosHeadlines Media Has Launched Its Native Token CHT.
Airdrop Is Live For Everyone, Claim Instant 5000 CHT Tokens Worth Of $50 USDT.
Join the Airdrop at the official website,
CryptosHeadlinesToken.com
Join Our Telegram channel to stay up to date on breaking news coverage
The Bitcoin price prediction is currently moving bearishly and seems to be preparing for the next move below the support level of $92,000.
Bitcoin Prediction Data:
- Bitcoin price now – $92,853
- Bitcoin market cap – $1.85 trillion
- Bitcoin circulating supply – 19.8 billion
- Bitcoin total supply – 19.8 billion
- Bitcoin Coinmarketcap ranking – #1
Bitcoin (BTC) exemplifies the transformative potential of early adoption in crypto projects. With a 24-hour price range of $91,317.14 to $94,903.32, BTC remains a powerhouse in the market. From its all-time low of $0.08761 in July 2010, BTC has soared by a staggering +190,696,669.81%, cementing its status as a revolutionary investment. Though currently -14.32% below its all-time high of $108,268.45 reached on December 17, 2024, Bitcoin’s unparalleled rise demonstrates the immense opportunities in getting in early on game-changing technologies.
BTC/USD Long-term Trend: Bullish (Daily Chart)
Key levels:
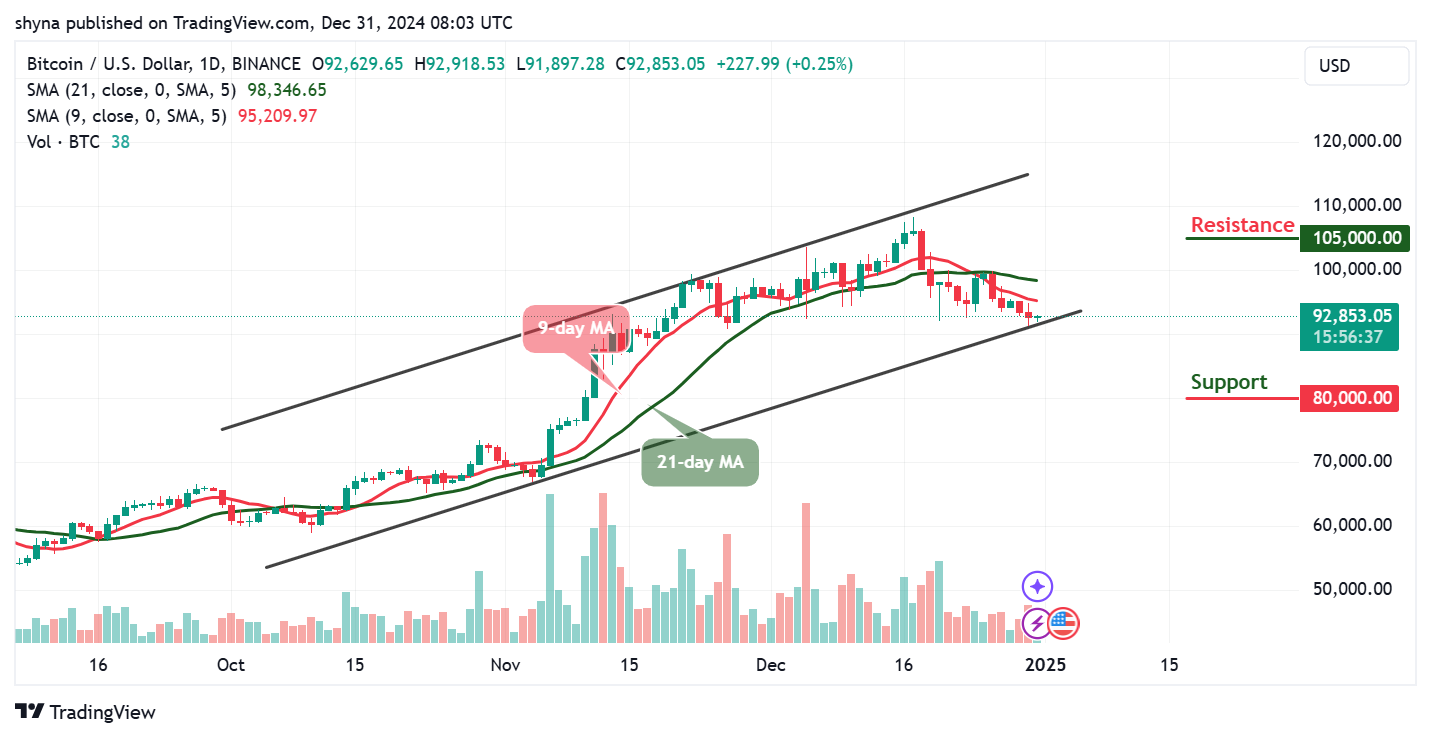
Resistance Levels: $105,000, $110,000, $115,000
Support Levels: $80,000, $75,000, $70,000

In the current market conditions, Bitcoin’s performance against the USD reflects a mix of reduced trading activity and evolving sentiment as we navigate the post-holiday period. As of now, the broader market remains heavily correlated, suggesting a unified response to external influences. Although the overall trading volume has shown a 60% increase, it remains significantly lower than the levels seen in prior weeks. This suggests that while there is renewed interest, the market is still lacking the robust participation required for a substantial bullish move.
Bitcoin Price Prediction: Bitcoin (BTC) May Face the Downside
BTC/USD is seen hovering at $92,853, with the current consolidation pattern, the king coin remains below the 9-day and 21-day moving averages. Though Bitcoin (BTC) begins the day off intending to trend higher but couldn’t. Meanwhile, any bullish cross above the 9-day and 21-day moving averages could hit the nearest resistance level of $93,000. Beneath this, other supports could be found at $80,000, $75,000, and $70,000.
Moreover, the Bitcoin price is likely to slide below the lower boundary of the channel as the technical indicator 9-day moving average (MA) remains below the 21-day moving average (MA). On the next positive move, BTC could break to the upside as the candle is yet to close. Therefore, if the bulls push the king coin to the north, the potential resistance levels could be found at $105,000, $110,000, and $115,000.
BTC/USD Medium-term Trend: Bearish (4H Chart)
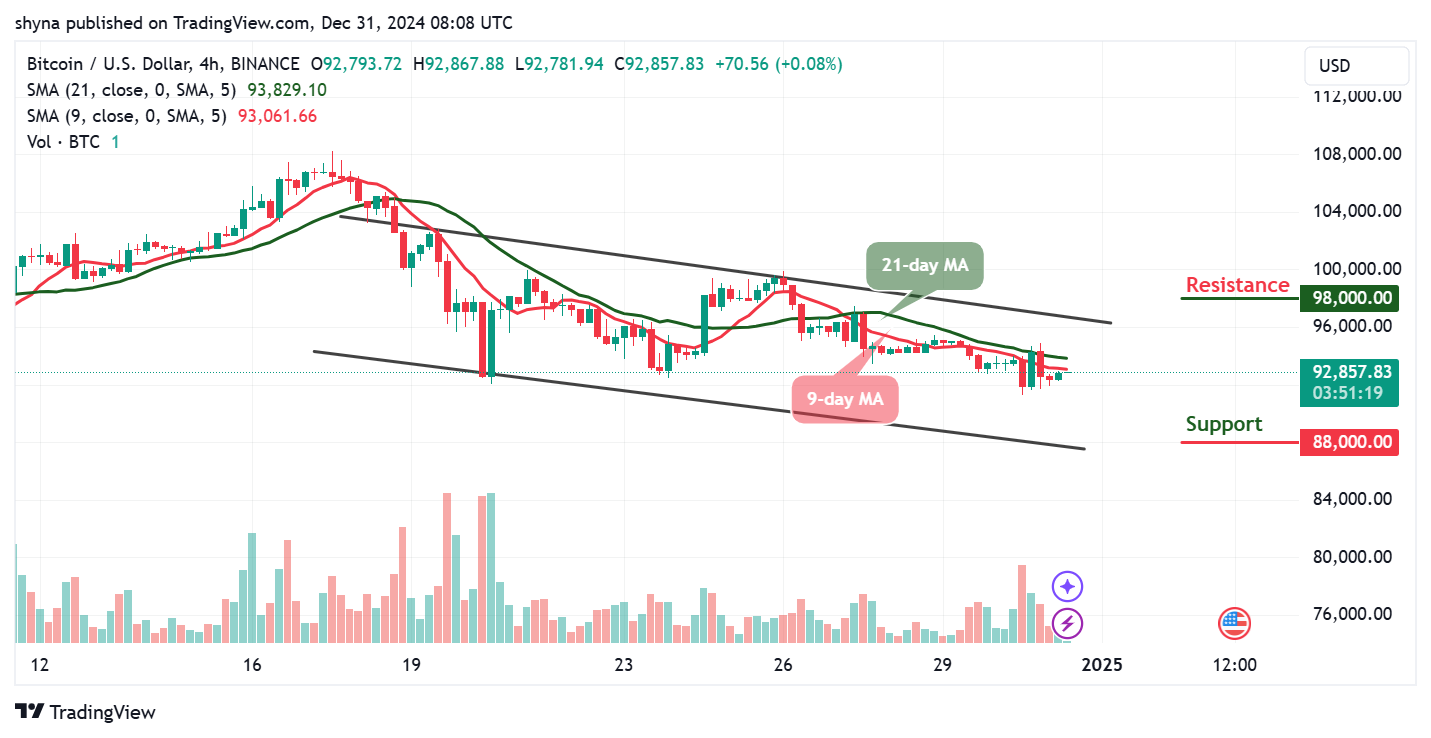
The 4-hour chart for Bitcoin (BTC) against the US Dollar shows the price moving within a descending channel, reflecting a short-term bearish trend. The resistance level is marked at $98,000 and above, while support is established at $88,000. Currently, BTC is trading at $92,857, slightly below the midpoint of the channel. The 9-day and 21-day Moving Averages (MAs) indicate ongoing bearish momentum, as the 9-day MA is below the 21-day MA. This alignment reinforces the current downward trend, but the recent consolidation near $92,800 suggests that the price may be stabilizing in preparation for a potential breakout.


Nevertheless, if the price manages to hold above the $92,000 level, a bullish breakout could occur, pushing the price toward the $94,000 – $96,000 zone, with the channel’s upper resistance at $98,000 as the next major target. On the downside, if selling pressure intensifies and the price breaks below $92,000, BTC could test the lower boundary of the channel near $88,000 and below. Volume fluctuations and interactions with the moving averages will be key indicators to watch, as they may confirm the likelihood of a reversal or continuation within the descending channel.
Crypto analyst @GoingParabolic, boasting over 248k followers on X (formerly Twitter), has observed that $BTC has re-entered the accumulation zone. In their view, a few weeks of consolidation could pave the way for a significant breakout, with a target of $131.5K+ by Q1 2025 appearing inevitable.
$BTC has re-entered the accumulation zone.
In my view, a few weeks of consolidation could set the stage for a massive breakout.
$131.5K+ by Q1 2025 feels inevitable. See you there. pic.twitter.com/vSKQTmTFF8
— Jason A. Williams (@GoingParabolic) December 29, 2024
Bitcoin Alternatives
Bitcoin’s potential for a bullish breakout hinges on factors like increased trading volume, renewed interest from U.S. investors, and improved market sentiment, though the current low activity and reduced volume suggest stronger catalysts are needed to drive sustained momentum. In contrast, Wall Street Pepe has emerged as a standout in the cryptocurrency space, defying the broader market slowdown by raising nearly $39 million in its presale phase, with impressive daily contributions of $500,000 – double the early performance of Pepe Unchained.
Wall Street Pepe Is Number One On This List – Should Be The Best Token To Buy Now For Gains In 2025
Wall Street Pepe combines the excitement of meme culture with powerful trading tools, offering features like signals, insider groups, and staking rewards to support informed investment decisions. Backed by a vibrant community and launching during the crypto bull run, it’s positioned for significant growth. With its innovative approach and early momentum, Wall Street Pepe presents a unique opportunity to join a project redefining the future of meme coins.
Related News
Newest Meme Coin ICO – Wall Street Pepe


- Audited By Coinsult
- Early Access Presale Round
- Private Trading Alpha For $WEPE Army
- Staking Pool – High Dynamic APY


Join Our Telegram channel to stay up to date on breaking news coverage


