CaryptosHeadlines Media Has Launched Its Native Token CHT.
Airdrop Is Live For Everyone, Claim Instant 5000 CHT Tokens Worth Of $50 USDT.
Join the Airdrop at the official website,
CryptosHeadlinesToken.com
CaryptosHeadlines Media Has Launched Its Native Token CHT.
Airdrop Is Live For Everyone, Claim Instant 5000 CHT Tokens Worth Of $50 USDT.
Join the Airdrop at the official website,
CryptosHeadlinesToken.com
- Bitcoin’s rising wedge pattern signals a potential bearish breakdown, opening the door for an altcoin surge.
- Bitcoin dominance is testing critical support; a breakdown could confirm bearish reversal and shift market momentum.
- Despite dominance concerns, Bitcoin’s historical patterns and RSI suggest a strong bullish outlook ahead.
According to analyst Mostache, Bitcoin’s dominance in market capitalization shows a rising wedge pattern that has been forming for four months now, suggesting a potential bearish breakdown. This would trigger altcoin gains, especially with the Federal Open Market Committee (FOMC) meeting only two days away.
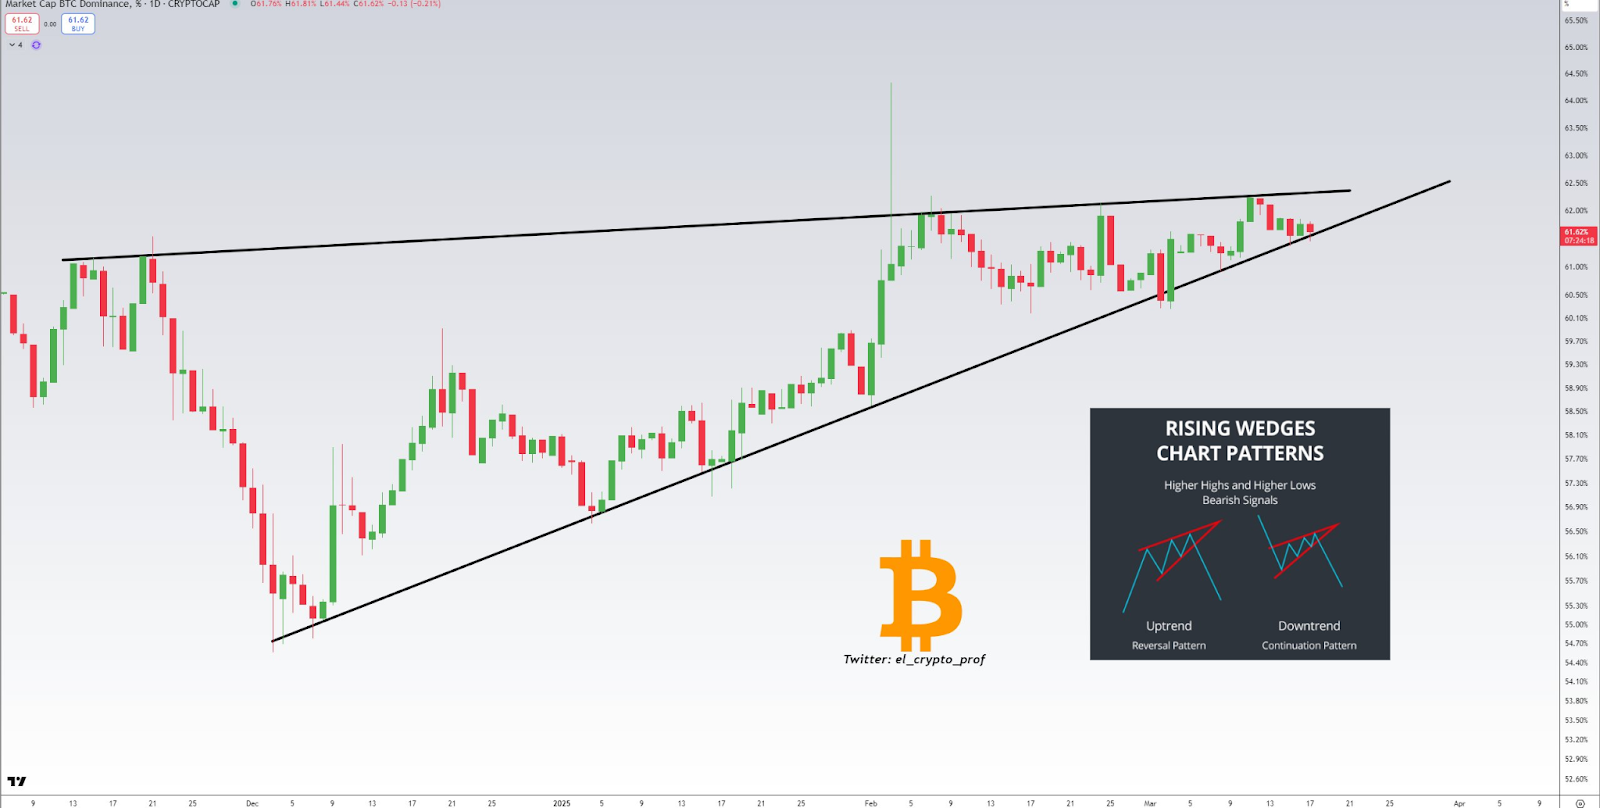
Bitcoin Dominance: Testing Key Support Levels
Bitcoin’s dominance pattern showcases converging trendlines with higher highs and higher lows. Traditionally, such formations indicate an impending bearish reversal. Initially, dominance trended downward until early December. Then, higher lows and highs shaped the rising wedge structure.
By mid-January, bullish momentum strengthened, pushing dominance higher. However, resistance along the upper trendline capped gains. Each high-faced rejection, signaling resistance pressure. Conversely, the lower trendline consistently supported the upward move. Early February witnessed a sharp spike, but the price retraced, highlighting rejection at higher levels.
Recently, dominance is hovering near the lower trendline, testing this critical support. A breakdown at this level could confirm the anticipated bearish reversal. The candlestick arrangement suggests a tightening range, indicating an imminent breakout.
Bitcoin’s Historical Patterns Indicate Bullish Prospects
Analyst Merlijn’s analysis shows Bitcoin’s price bullish trend following the 2016-2017 cycle leading to a possible rally. Next, the price of Bitcoin rose steadily after breaking above the 200-day moving average. The consolidation phase was that of accumulation prior to rising sharply.
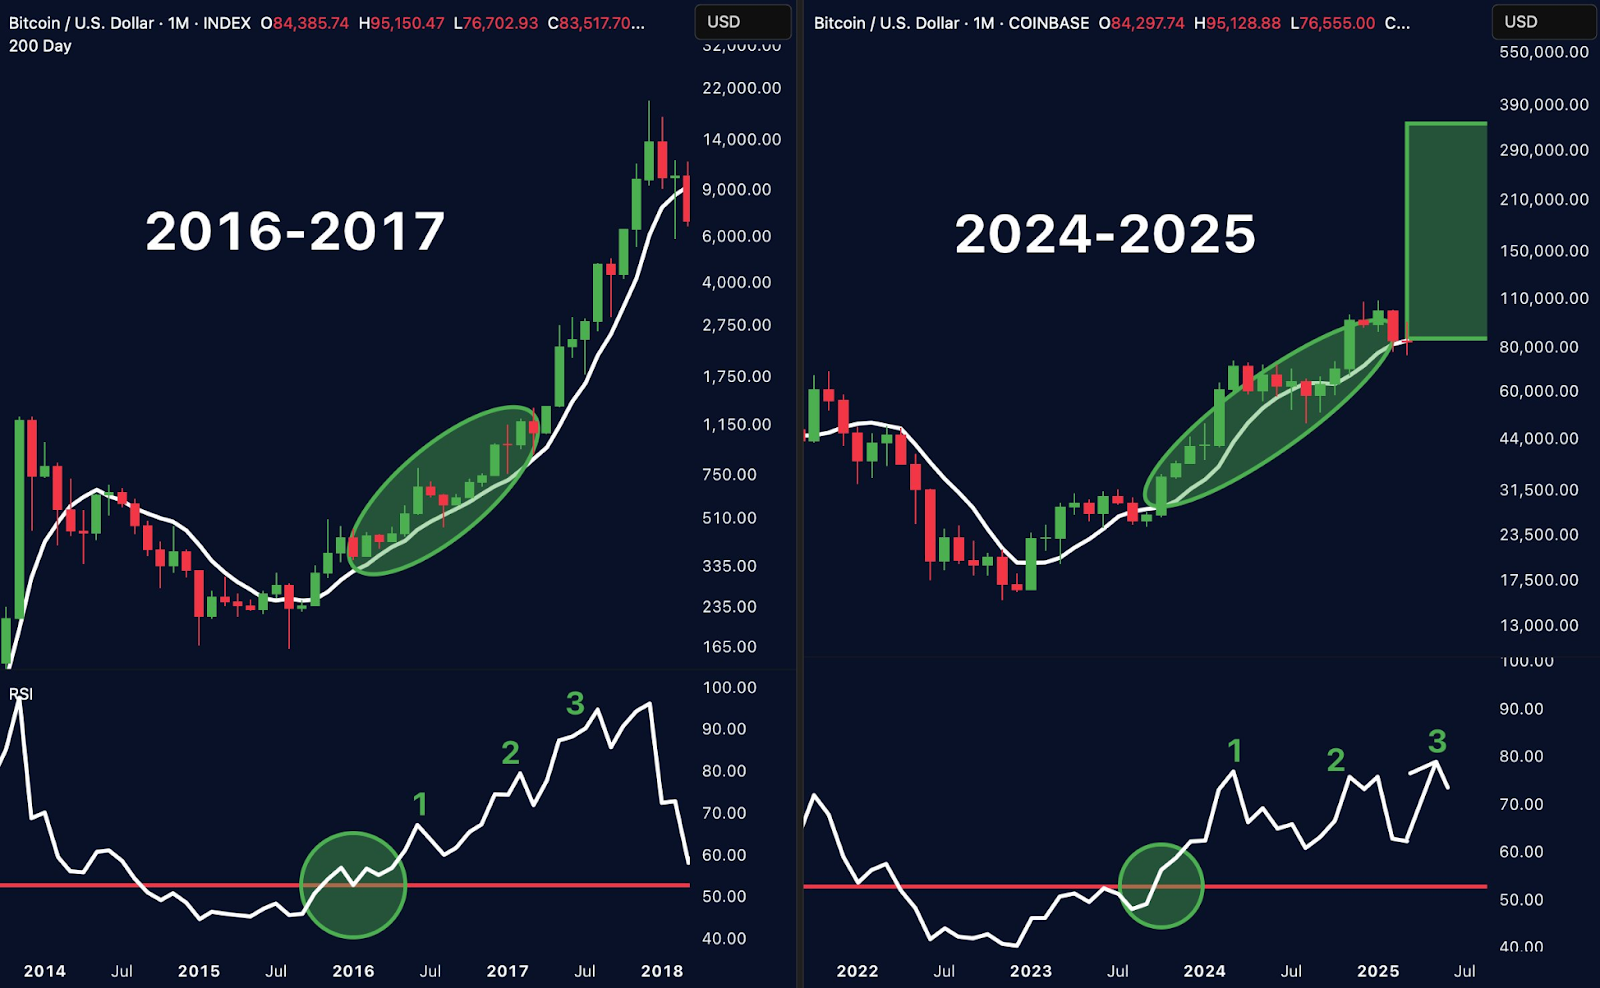
The Relative Strength Index (RSI) also aligns with historical trends. In 2016-2017, three RSI peaks accompanied Bitcoin’s price growth. Similarly, the 2024-2025 chart showcases three corresponding RSI peaks. The initial peak aligns with the breakout, followed by sustained upward momentum. This similarity suggests strong bullish potential for Bitcoin.