
 CaryptosHeadlines Media Has Launched Its Native Token CHT.
Airdrop Is Live For Everyone, Claim Instant 5000 CHT Tokens Worth Of $50 USDT.
Join the Airdrop at the official website,
CryptosHeadlinesToken.com
CaryptosHeadlines Media Has Launched Its Native Token CHT.
Airdrop Is Live For Everyone, Claim Instant 5000 CHT Tokens Worth Of $50 USDT.
Join the Airdrop at the official website,
CryptosHeadlinesToken.com
Ethereum (ETH) price chart is displaying bullish patterns that suggest Ethereum is set to breakout from this bearish trend.
On-chain data and analyst insights suggest that ETH might be ready for an upswing over the short term following its current chart patterns and the market condition.
The Pattern from 2023: A Setup for Larger Gains?
JavonTM1 indicates that Ethereum currently mirrors a pattern from 2023. In that period, Ethereum formed a series of rounded bottoms, with each bottom followed by significant upward price movement.
After forming these bottoms, ETH saw a massive climb in price, which many traders saw as the beginning of a bullish trend.

The difference is that the current trend is happening on a larger scale than the 2023 movement potentially paving the way to a stronger price surge for Ethereum.
Since previous similar patterns have played out in this manner, this could mean that the market is getting set for a broader rally that may push ETH to new highs.
Falling Wedge Formation Indicates Reversal Potential
The formation of a falling wedge pattern on the daily chart is a significant bullish signal.
It is defined by two downward-sloping trend lines converging toward one common point.
Typically a weakening of a downward momentum and usually met with an upward breakout.
Ethereum’s price has been forming this wedge for the past several weeks where it forms lower highs and lower lows.
The current price of around $1,805.81 places ETH near the lower boundary of the wedge.
The falling wedge will be considered completed if the asset breaks to the upside of the upper trend line and also exhibits increased volume. If the bullish pattern is confirmed Ethereum is set to rally to around $3,250.
As for the technical target for a breakout from the wedge, it is set at around $3,250, which is based on the vertical length of the wedge above the breakout level.
If price holds and continues to act according to history, then this is a potential upside near 80% from the current price.
Ethereum Price Technical Analysis Data
The Relative Strength Index (RSI) for Ethereum is currently at 36.03 level indicating that the market is already in the oversold territory.
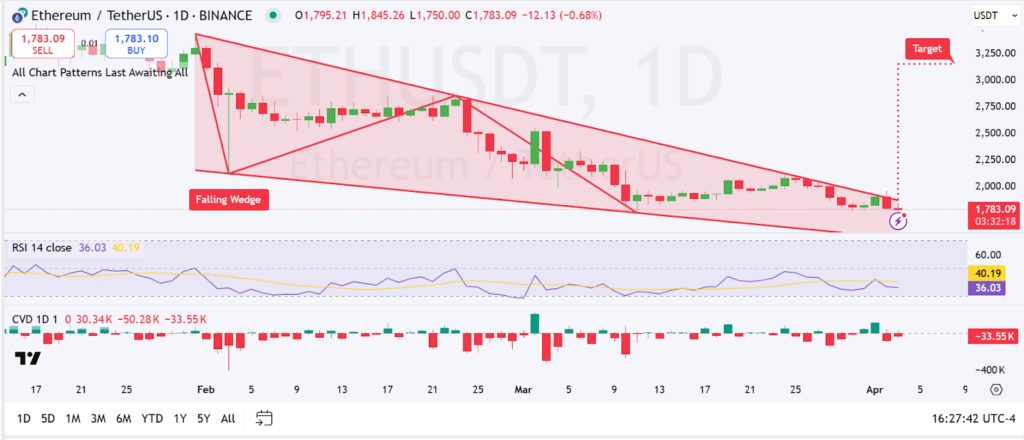
Cumulative Volume Delta (CVD) is also -33.55K, further suggesting that selling pressure has been controlling the market.
But there are indications that this pressure is easing off with recent volume.
The shift to positive CVD would be in line with a possible breakout out of the falling wedge.
Exchange Supply Continues to Decline
The bullish technical outlook is supported by on chain metrics.
Ethereum reserves on exchanges have fallen to 18.2 million, according to data from CryptoQuant.
While this numbers trend continues, it indicates that ETH holders are removing the crypto from trading platforms and storing it long term or in staking contracts.

Additionally, this trend indicates that large holders are not exiting their positions.
Instead, they appear to be accumulating or holding their assets off exchanges in anticipation of future gains.
Capital Flows Reinforce Positive Outlook For Ethereum Price
New data from Top7ICO shows growing capital inflows in Ethereum as well as other blockchain networks.
With $250.6 Million worth of net inflows, Ethereum recorded the highest net inflow in the past week.
Sonic was just behind at $101.1 Million, while Base rounded out the chart at $101.4 Million.
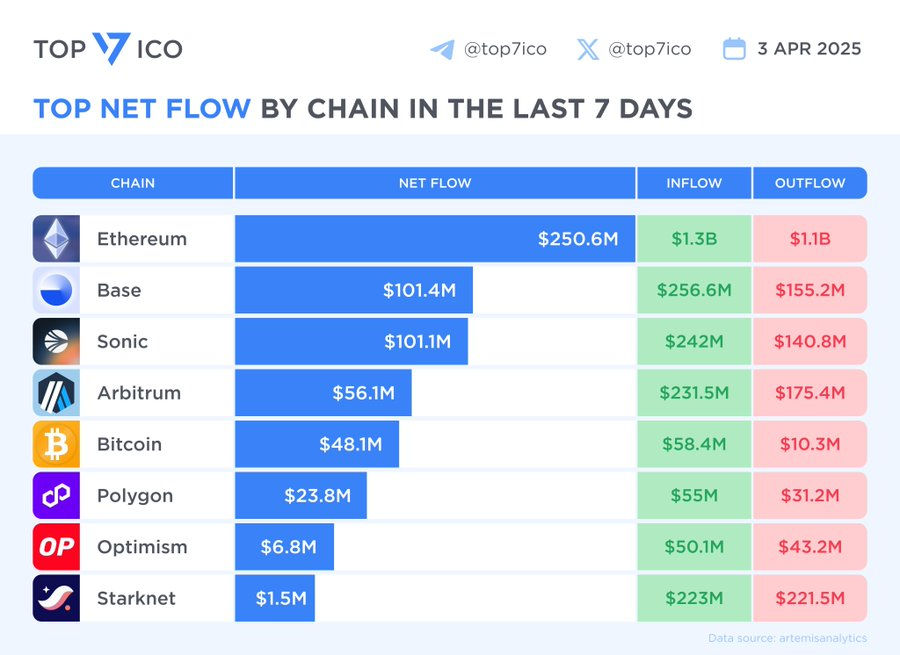
These figures reflect strong investor confidence and increased network activity across major chains.
Rising inflows can signal accumulation by traders and institutions, especially when accompanied by technical setups that suggest a reversal.
Ethereum’s strong net inflows support the current bullish narrative, indicating growing interest from market participants.