
 CaryptosHeadlines Media Has Launched Its Native Token CHT.
Airdrop Is Live For Everyone, Claim Instant 5000 CHT Tokens Worth Of $50 USDT.
Join the Airdrop at the official website,
CryptosHeadlinesToken.com
CaryptosHeadlines Media Has Launched Its Native Token CHT.
Airdrop Is Live For Everyone, Claim Instant 5000 CHT Tokens Worth Of $50 USDT.
Join the Airdrop at the official website,
CryptosHeadlinesToken.com
Chainlink’s (LINK) price action has entered a critical phase that bears remarkable similarities to patterns observed in 2021, according to crypto analyst Rekt Capital.
After consolidating within a “Macro Triangular market structure” for most of 2024, LINK broke out to levels above $25 before entering a downtrend that has pushed the price back inside the pattern.
The current price movement is what the analyst describes as a “volatile post-breakout retest.” As per the data, LINK created a “downside deviation” into a historical demand area.
Crucial Chainlink support level must hold to enable recovery
The key factor deciding Chainlink’s next major move appears to be its ability to maintain support at the current demand zone highlighted by Rekt Capital.
This historical demand area around $14.34 has previously served as a foundation for price recovery.
This was notably seen during the mid-2021 period when LINK produced downside wicks into this region before recovering.
“LINK is in the process of retesting this general region as new support,” Rekt Capital explains.
He emphasized that the token “needs to successfully continue to hold this area as support to position itself for upside going forward.”
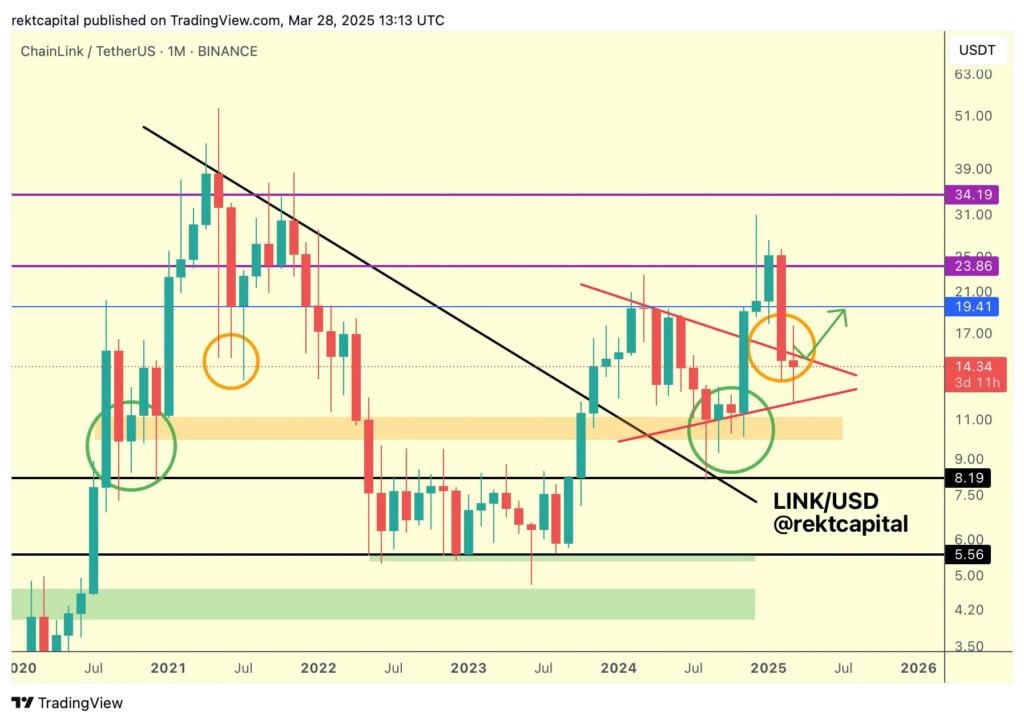
What makes this support particularly important is its role in potentially allowing LINK to retest the upper boundary of its triangular market structure.
“More importantly, this retest of the green area as support is essential to position LINK for a successful retest of the top of its triangular market structure,” the analyst notes.
Fellow analyst BullishBanter shares a similar view of the current support level. He described it as a “key demand zone” where “price swept liquidity.”
His analysis points to potential upside targets, noting that LINK “could be gearing up for a reaction” with “eyes on the FVG fill and 15.50+ target if we get a strong push.”

Downside Deviation Pattern Repeats From 2021 Cycle
The current market structure of Chainlink displays what Rekt Capital identified as a “downside deviation” below the macro triangular pattern.
The key distinction this time is in how the deviation is manifesting on the charts. “Back in mid-2021, LINK produced a downside deviation into this price area in the form of multiple Monthly downside wicks,” the analyst noted, adding,
“This time, LINK is downside deviating once again but in the form of actual candle-bodied closes rather than downside wicks.”
This shift from wicks to candle-body closes suggests a more sustained presence at these lower levels compared to the 2021 pattern.
Wicks usually show rejection of lower prices, while full candle closes show more persistent trading at those levels.
Looking at the current price action in context, LINK has retraced to test both the upper boundary of its historical demand zone and the lower boundary of its previous macro triangle.
Monthly Close Crucial for Confirming Bull Case for Chainlink
The upcoming monthly close will be a decisive technical event for Chainlink, according to Rekt Capital. The analyst posed a direct question regarding this timeframe:
“Can LINK Monthly Close above the triangle top later this month?…Doing so would position price for a successful retest, despite the downside deviation.”
Currently, LINK trades at approximately $13 range, with technical levels at $19.41, $23.86, and $34.19 marked as key resistance zones on the chart.
The successful recovery and monthly close above the triangle top would likely target these levels in sequence, with the $19.41 area as the first major hurdle.
Looking at historical price data, LINK’s all-time high remains at $52.70, recorded during the 2021 bull market. The current price is a 72.8% drawdown from that peak.
The analysis for LINK comes amid a mixed performance period for the overall cryptocurrency market.
Many altcoins are also seeing similar retests of key support levels following their initial breakouts from long-term accumulation patterns.