
 CaryptosHeadlines Media Has Launched Its Native Token CHT.
Airdrop Is Live For Everyone, Claim Instant 5000 CHT Tokens Worth Of $50 USDT.
Join the Airdrop at the official website,
CryptosHeadlinesToken.com
CaryptosHeadlines Media Has Launched Its Native Token CHT.
Airdrop Is Live For Everyone, Claim Instant 5000 CHT Tokens Worth Of $50 USDT.
Join the Airdrop at the official website,
CryptosHeadlinesToken.com
Key takeaways:
- Chainlink could reach a maximum value of $24.99 in 2025.
- By 2028, LINK could reach a maximum price of $82.27.
- In 2031, Chainlink will range between $218.59 and $265.79.
Chainlink (LINK) emerged as a prominent player in the cryptocurrency market. It provides a decentralized oracle network that connects smart contracts with real-world data. As the adoption of decentralized finance (DeFi) and blockchain technology continues to grow, Chainlink’s innovative solutions have attracted significant attention from investors and developers alike.
Chainlink continues to expand its reach and utility across the blockchain ecosystem, showcasing its robust integration capabilities. Recent updates highlight 14 new integrations of 5 Chainlink services across 10 different blockchain platforms, including prominent names like Arbitrum, Avalanche, and Ethereum. These integrations enhance Chainlink’s network and solidify its position as a critical player in decentralized applications’ interoperability and functionality.
Understanding Chainlink’s potential price movements involves analyzing market trends, technological advancements, partnerships, and overall market sentiment. This chainlink price history prediction aims to provide insights into its future performance by examining technical analysis and fundamental aspects that could influence its value.
Overview
| Cryptocurrency | Chainlink |
| Token | LINK |
| Price | $15.59 |
| Market Cap | $9.94B |
| Trading Volume | $954.24M |
| Circulating Supply | 638.09M LINK |
| All-time High | $52.88 May 09, 2021 |
| All-time Low | $0.1263 Sep 23, 2017 |
| 24-hour High | $16.44 |
| 24-hour Low | $13.17 |
Chainlink price prediction: Technical analysis
| Metric | Value |
| Price prediction | $18.30 (13.43%) |
| Volatility | 10.04% |
| 50-day SMA | $20.16 |
| 14-day RSI | 38.98 |
| Sentiment | Bearish |
| Fear & Greed Index | 20 (Extreme Fear) |
| Green days | 12/30 (40%) |
| 200-day SMA | $16.95 |
Chainlink price analysis: LINK price dips 1.61% as market volatility increases
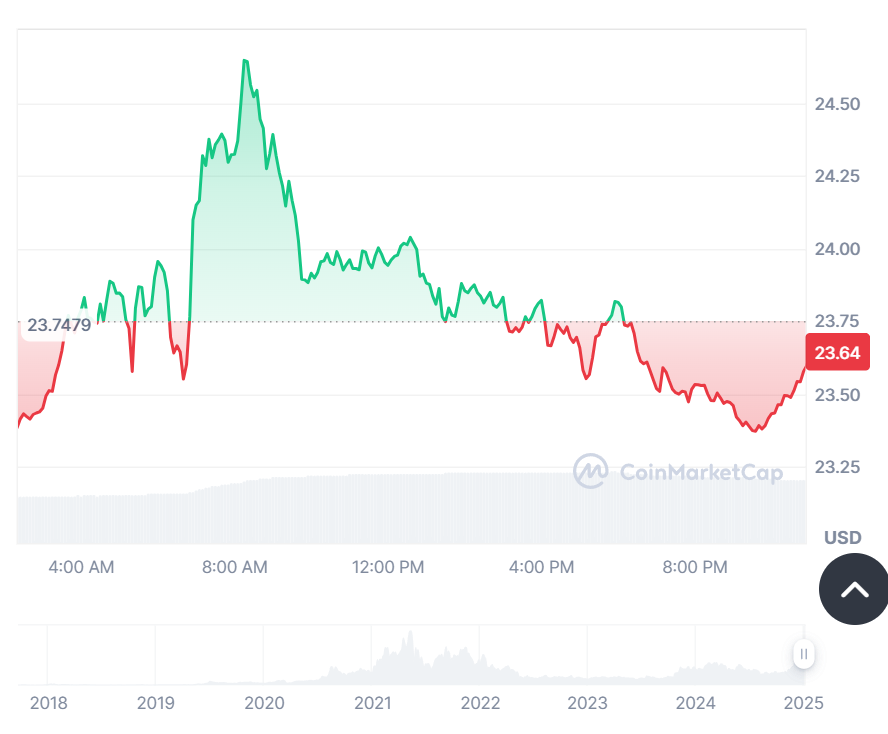
Chainlink (LINK) on 30th March is trading at $13.71, reflecting a 1.61% decline over the past 24 hours. The cryptocurrency has experienced fluctuations, with a daily low of $13.40 and a high of $14.00, indicating a volatile trading session. Despite the recent dip, LINK remains one of the most actively traded altcoins, with investors closely watching its price movements.
The current market sentiment around LINK is mixed, with some traders anticipating a potential recovery while others remain cautious about further declines. Chainlink continues to expand its partnerships and integrations within the blockchain space, strengthening its position as the leading decentralized oracle network. However, broader market conditions and external factors like Bitcoin’s price movement influence LINK’s short-term price action.
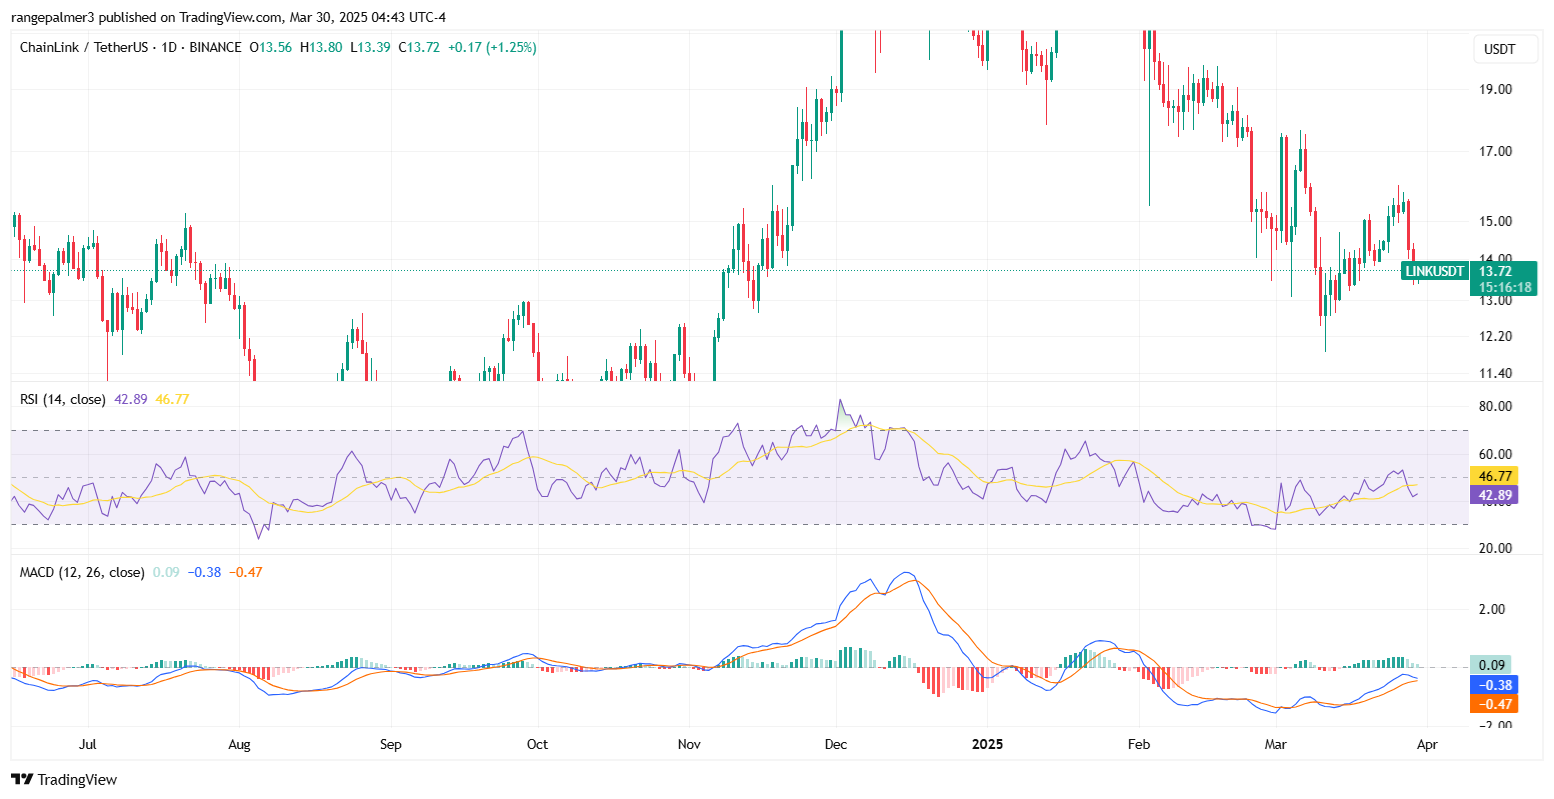
Chainlink analysis on the daily timeframe: LINK faces resistance at $14.00 amid bearish pressure
On the daily chart, LINK has been experiencing strong resistance near the $14.00 level. The price attempted to break above this key resistance but faced selling pressure, pushing it back to the $13.70 range. The 50-day moving average (MA) is hovering around $14.20, acting as a dynamic resistance, while the 200-day MA is trending lower, indicating a weakening bullish momentum.

The Relative Strength Index (RSI) is currently near 48, suggesting neutral momentum with no strong overbought or oversold conditions. If the RSI moves below 45, LINK could face further downside pressure toward the $13.20 support level. The MACD indicator shows a slight bearish crossover, signaling potential downside continuation if buyers do not regain control. Volume levels remain moderate, suggesting indecisiveness among traders.
Chainlink analysis on the 4-hour chart: LINK struggles to gain momentum as $13.80 resistance holds
On the 4-hour chart, LINK shows a slight recovery after testing the $13.40 support level. The price has rebounded toward $13.72, but upside momentum remains weak. The short-term moving averages, particularly the 20-EMA, act as immediate resistance near $13.80, preventing further gains.

If LINK breaks above $13.80, it could test the $14.00 resistance level again. However, failure to maintain bullish momentum may lead to a retest of the $13.50 support. A break below this level could accelerate losses toward $13.20, where buyers may look to step in. The Bollinger Bands indicate decreasing volatility, suggesting a potential breakout in either direction.
Chainlink technical indicators: levels and action
Daily simple moving average (SMA)
| Period | Value | Action |
| SMA 3 | $ 16.83 | SELL |
| SMA 5 | $ 16.15 | SELL |
| SMA 10 | $ 16.38 | SELL |
| SMA 21 | $ 17.59 | SELL |
| SMA 50 | $ 20.16 | SELL |
| SMA 100 | $ 21.37 | SELL |
| SMA 200 | $ 16.95 | SELL |
Daily exponential moving average (EMA)
| Period | Value | Action |
| EMA 3 | $ 17.64 | SELL |
| EMA 5 | $ 18.71 | SELL |
| EMA 10 | $ 19.87 | SELL |
| EMA 21 | $ 20.95 | SELL |
| EMA 50 | $ 21.00 | SELL |
| EMA 100 | $ 19.07 | BUY |
| EMA 200 | $ 16.91 | BUY |
Recent news on Chainlink
OpenUSDT, an interoperable version of the world’s largest stablecoin $USDT created for the OP Superchain ecosystem, has adopted Chainlink CCIP for cross-chain transfers.
Is Chainlink a good investment?
Chainlink (LINK) is a decentralized oracle network crucial in connecting real-world data to blockchain systems. It has gained significant traction, forming strong partnerships and expanding its presence in areas like decentralized finance (DeFi) and tokenized assets. While it holds promising long-term potential and recent trends suggest a bullish outlook, it’s important to remember that the cryptocurrency market is highly unpredictable. If you’re considering investing, research thoroughly and carefully weigh the risks.
Will Chainlink recover?
Chainlink’s price has declined recently, with minor short-term recoveries; however, the move is gradual. The general trend remains bearish as it seeks support.
Will Chainlink reach $50?
Based on long-term forecasts, Chainlink (LINK) is projected to reach $50 by 2027 as its ecosystem and user adoption continue to grow.
Will Chainlink reach $100?
Chainlink can reach $100 in the year 2029, per expert predictions.
Does Chainlink have a good long-term future?
Chainlink shows some stabilization and potential for recovery, indicating the token may have a promising long-term future.
Chainlink price prediction March 2025
For March 2025, Chainlink is primed for notable growth. The minimum projected trading price is $23.66, with an average of around $24.55. LINK is expected to attain a peak price of $25.68.
| Chainlink Price Prediction | Potential Low | Average Price | Potential High |
| Chainlink price prediction March 2025 | $23.66 | $24.55 | $25.68 |
Chainlink (LINK) price prediction 2025
The market price for LINK is expected to reach a maximum of $24.99 in 2025. However, traders can expect a minimum trading price of $21.39 and an expected average trading price of $22.03.
| Chainlink Price Prediction | Potential Low | Average Price | Potential High |
| Chainlink price prediction 2025 | $21.39 | $22.03 | $24.99 |
Chainlink price prediction 2026-2031
| Year | Minimum | Average | Maximum |
| 2026 | $32.18 | $33.28 | $37.38 |
| 2027 | $47.03 | $48.36 | $55.23 |
| 2028 | $68.54 | $70.96 | $82.27 |
| 2029 | $100.27 | $103.11 | $120.08 |
| 2030 | $149.09 | $154.25 | $176.11 |
| 2031 | $218.59 | $226.30 | $265.79 |
Chainlink price prediction 2026
In 2026, Chainlink is expected to reach a maximum value of $37.38, a minimum price of $32.18, and an average value of $33.28.
Chainlink price prediction 2027
In 2027, LINK’s average price is expected to be $48.36; its minimum and maximum trading prices are predicted to be $47.03 and $55.23, respectively.
Chainlink price prediction 2028
The price of Chainlink is predicted to reach a minimum level of $68.54 in 2028. LINK can reach a maximum level of $82.27, and an average price of $70.96.
Chainlink price prediction 2029
The Chainlink price prediction for 2029 suggests a minimum price of $100.27, a maximum price of $120.08, and an average forecast price of $103.11.
Chainlink price prediction 2030
In 2030, Chainlink prediction expects LINK to reach a maximum value of $176.11, a minimum price of $149.09, and an average value of $154.25.
Chainlink price prediction 2031
The price of Chainlink is predicted to reach a minimum value of $218.59 in 2031. If the bulls hold, investors can anticipate a maximum price of $265.79 and an average trading price of $226.30.

Chainlink market price prediction: Analysts’ LINK price forecast
| Firm | 2025 | 2026 |
| Gov.Capital | $24.68 | $58.786 |
| DigitalCoinPrice | $49.83 | $58.20 |
| CoinCodex | $ 22.84 | $ 73.94 |
Cryptopolitan’s Chainlink price prediction
According to our Chainlink price forecast, the coin’s market price might reach a maximum value of $24.99 by the end of 2025. In 2026, the value of LINK could surge to a maximum price of $37.38.
Chainlink’s historic price sentiment
- Chainlink launched at around $0.20, and remained under $1 throughout 2018, with moderate market cap growth. In 2019, LINK had substantial growth, reaching $1 in May and peaking around $3 by year-end, driven by its utility in providing reliable data feeds for smart contracts.
- 2020 marked a breakout year as LINK surged from $2 to $20 by August, fueled by DeFi demand. In 2021, it reached an all-time high of around $52 in May but dropped to $22 by mid-year due to market volatility.
- In 2022, LINK ranged between $15 and $25 amid broader market corrections. In 2023, it further declined, stabilizing in the $6 to $13 range as investor sentiment cooled.
- Starting 2024 at $15, LINK briefly spiked to $18 in February before falling to $12 by April. The coin’s price has fluctuated throughout 2024, peaking near $15 in May, dropping to around $10 by August, and stabilizing between $10 and $12.28 in October. In November, LINK is trading within the range of $10.68 to $11.94. In December, LINK maintained a range of $18.43 to $30.94.
- In January 2025, Chainlink peaked at $22.9 but lost momentum towards the end of the month, leading to a trading range of $19.20- $21.00 in February.
- In March 2025, Chainlink (LINK) experienced a strong upward trend, starting at approximately $13.73 and steadily rising to $16.02, with periods of volatility.