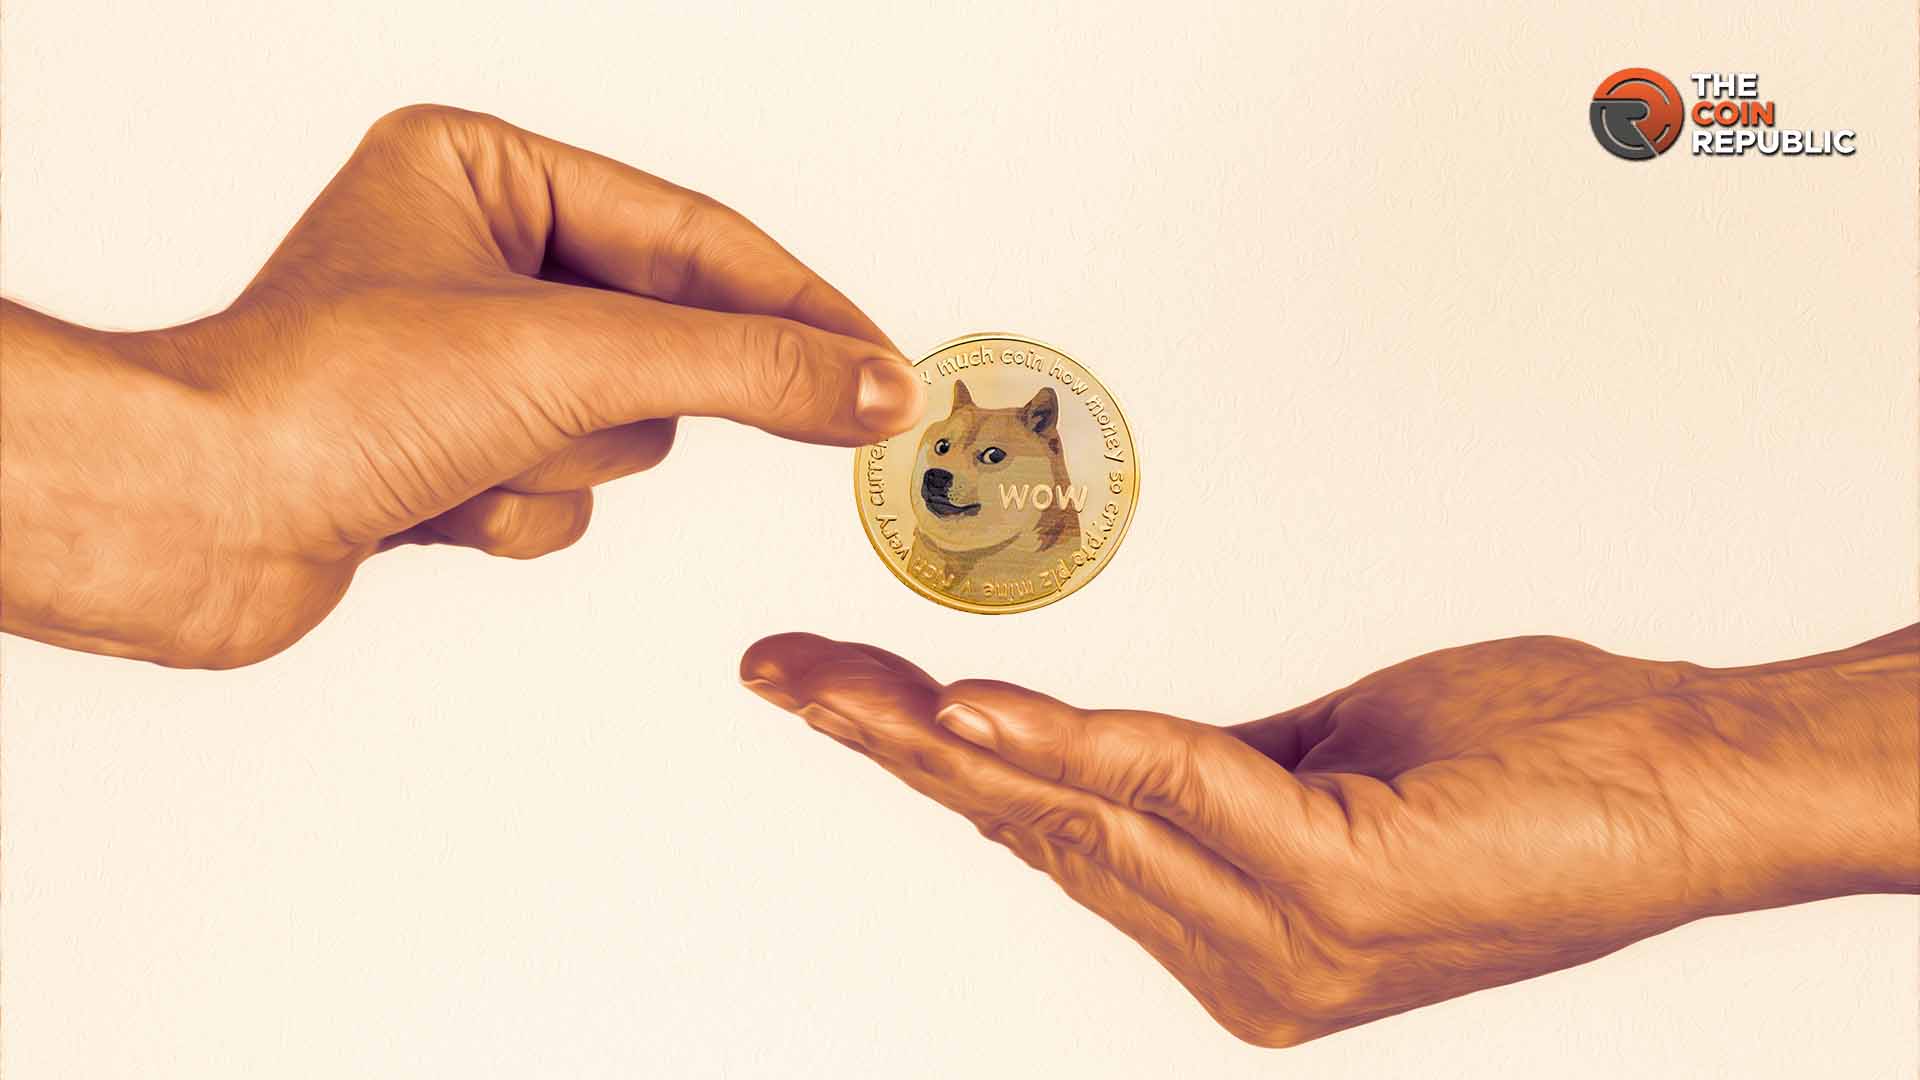
In the last 24 hours, 5.8 billion Dogecoin tokens have been transferred, signaling a shift in market behavior. Dogecoin price is at $0.3983, DOGE has seen a 1.68% decrease. However, its trading volume surged by 21.50%, reaching $3.64 billion.
The increase in transactions, combined with previously dormant tokens moving, suggests a major market change could be underway. Technical indicators, including the 200 EMA, point to DOGE potentially entering a bullish phase soon, adding to the growing speculation.
Dogecoin Price Sees Major Surge in Activity as 5.8 Billion Tokens Move
Dogecoin price has seen huge additional transaction volume, with 5.8 billion tokens traded in the last 24 hours. The sharp rise is preceded by a length of time when these tokens had not been active.
The volume on Dogecoin’s chart has been spiking up. But, trading volume usually shows a rough indication of the price of an altcoin. Such volume spikes on the chart are often a change in market behavior. Dogecoin’s price has gone up in response.

Recent activity has been signaling a very strong comeback from the Dogecoin area. It comes with a lot of renewed attention from both long-term holders as well as from new investors.
Shift in market dynamics can often be seen with long dormant tokens starting to move. In most cases, this could be because long-term holders are selling or new market participants are joining.
– Advertisement –
This uptick in activity could be the start of further price action as market participants respond to these changes.
Whale Activity and Accumulation Phase Indicate Possible Breakout
Dogecoin has gone into an accumulation phase, where its price has been in a tight range. Dogecoin’s highs this month were seen late in the first week of the month, while lows were hit on the third day following a sharp decline in the price of the token.
It’s been range-bound since between support near $0.33840 and resistance around $0.48310. This is where an odds-facing phase is most common, when buyers and sellers are in a standoff and no side has the upper hand.

Nevertheless, sideways movement in this period often results in a breakout at some point, and increased whale activity may be a catalyst to push the price in a new direction.
This time has been particularly noticeable for whale activity. It’s common to see large movements of Dogecoin by whale investors as a sign of market manipulation or big upcoming moves.
They often have sufficient power to cause prices to move in either direction, and their activity in the market can cause prices to spike.
Dogecoin Appears Bullish According To Technical Indicators
Technical indicators of a Dogecoin also show signs of a probable increase in price. The 200-day EMA is also one of the key indicators to watch out for, particularly on its 3-day chart, and what we are seeing is the slope of the 200-day EMA is upward.
Whenever Dogecoin crosses upwards, the 200 EMA has historically given big upward momentum. This has been a crossover that has often been followed by a strong bullish move, as prices have increased greatly after the EMA starts going up.

As of present, the 200 EMA is popping up, which a lot of traders see as a portent of the new bull run. In fact, the upward movement of the EMA, together with the recent surging volumes, suggests that Dogecoin is likely to start another price rally.


