 CaryptosHeadlines Media Has Launched Its Native Token CHT.
Airdrop Is Live For Everyone, Claim Instant 5000 CHT Tokens Worth Of $50 USDT.
Join the Airdrop at the official website,
CryptosHeadlinesToken.com

- Ethereum trades below $1,810 as bearish momentum dominates market sentiment.
- Sustained exchange outflows signal defensive positioning by ETH investors.
- RSI and MACD reflect weak momentum, with no clear signs of reversal yet.
Ethereum’s price fell below the $1,810 mark recently as increasing bearish pressure emerged across the crypto market. Current technical and on-chain indicators reflect a cautious investor stance. Trading activity shows signs of declining, consistent spot outflows continue, and weak momentum metrics signal a possible continuation of the downward trend.
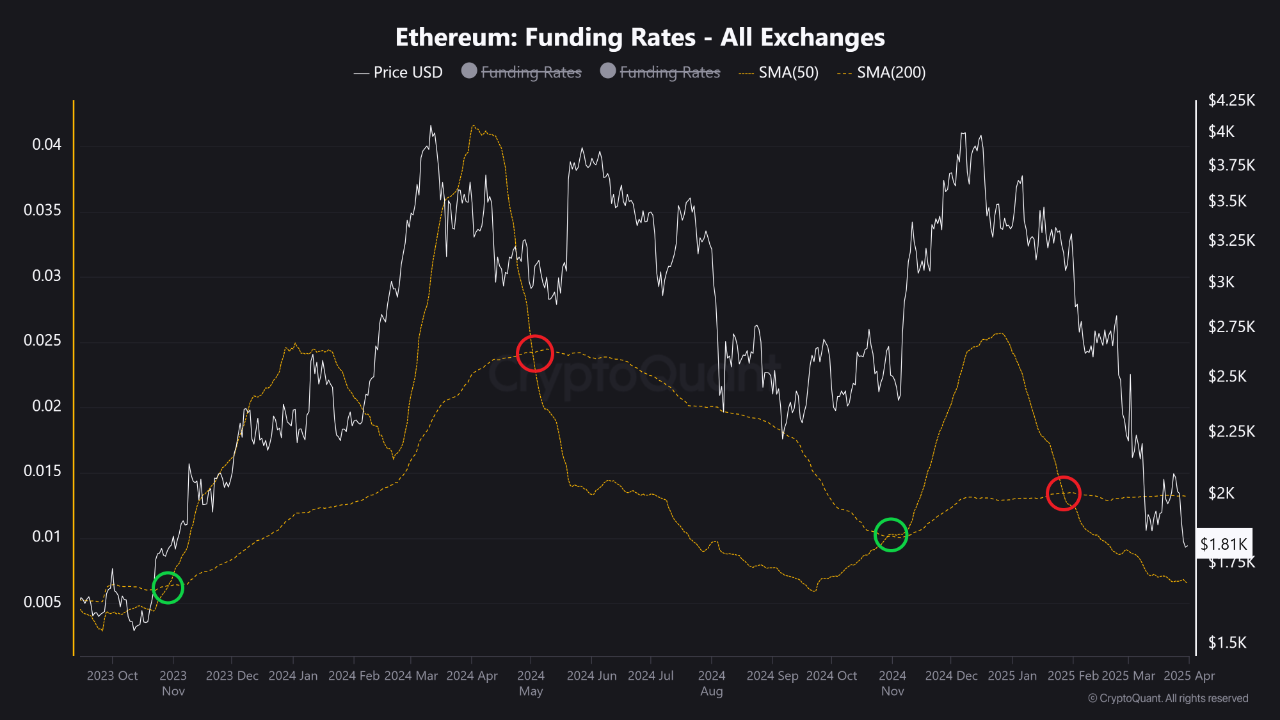
According to recent market data, Ethereum’s funding rates across major exchanges shifted into negative territory. This suggests many derivatives traders currently avoid high-risk leveraged long positions on ETH. Historical patterns observed between ETH funding rates and subsequent price action often show a strong correlation.

How Have Past Indicators Predicted ETH Price Shifts?
Previous bullish and bearish crossovers of key Simple Moving Averages (SMAs), like the 50-day and 200-day, also aligned historically with major Ethereum price shifts.
A bullish SMA…
The post ETH History Lesson: SMA Crossovers Previously Signaled Major Price Shifts appeared first on Coin Edition.


