")


 CaryptosHeadlines Media Has Launched Its Native Token CHT.
Airdrop Is Live For Everyone, Claim Instant 5000 CHT Tokens Worth Of $50 USDT.
Join the Airdrop at the official website,
CryptosHeadlinesToken.com
CaryptosHeadlines Media Has Launched Its Native Token CHT.
Airdrop Is Live For Everyone, Claim Instant 5000 CHT Tokens Worth Of $50 USDT.
Join the Airdrop at the official website,
CryptosHeadlinesToken.com
Key takeaways
- In 2025, HBAR is expected to trade between $0.39 and $0.34, with an average trading price of $0.30.
- In 2028, HBAR is predicted to trade at a maximum price of $1.01, with an average price of $0.83.
- By 2031, HBAR could trade between $2.56 and $3.04, with an average price of $2.63.
Hedera Hashgraph (HBAR) cryptocurrency is one of the altcoins that enjoyed the bullish crypto market of 2021. As a result, traders and investors have since taken a keen interest in the digital coin. Moreover, the Hedera Hashgraph network shows prospects of becoming a force in the blockchain space.
Every crypto investor asks: When will HBAR’s price rise again? Despite the overall bear market, the price momentum of the HBAR coin has been somewhat positive. With trading indicators pointing at a possible uptrend and the positive perception of HBAR, we might see a bullish scenario happening sooner: perhaps a retest of its all-time high.
Overview
| Cryptocurrency | Hedera Hashgraph |
| Ticker | HBAR |
| Current Price | $0.1732 |
| Market Cap | $7.31B |
| Trading Volume (24Hr) | $197.41M |
| Circulating Supply | 50B HBAR |
| All-time High | $0.5701 on Sep 16, 2021 |
| All-time Low | $0.01001 on Jan 03, 2020 |
| 24-hour High | $0.185 |
| 24-hour Low | $0.1725 |
HBAR price prediction: Technical analysis
| Metric | Value |
| Volatility | 11.14% |
| 50-day SMA | $ 0.207583 |
| 200-day SMA | $ 0.18421 |
| Sentiment | Bearish |
| Fear & Greed Index | 32 (Fear) |
| Green Days | 16/30 (53%) |
Hederah Hashgraph (HBAR) price analysis
- HBAR is trading near the lower Bollinger Band on the 4-hour chart indicating bearish pressure
- MACD and Balance of Power suggest weak buying momentum and seller dominance
- Price may remain sideways or dip further unless it breaks above the $0.18 resistance level
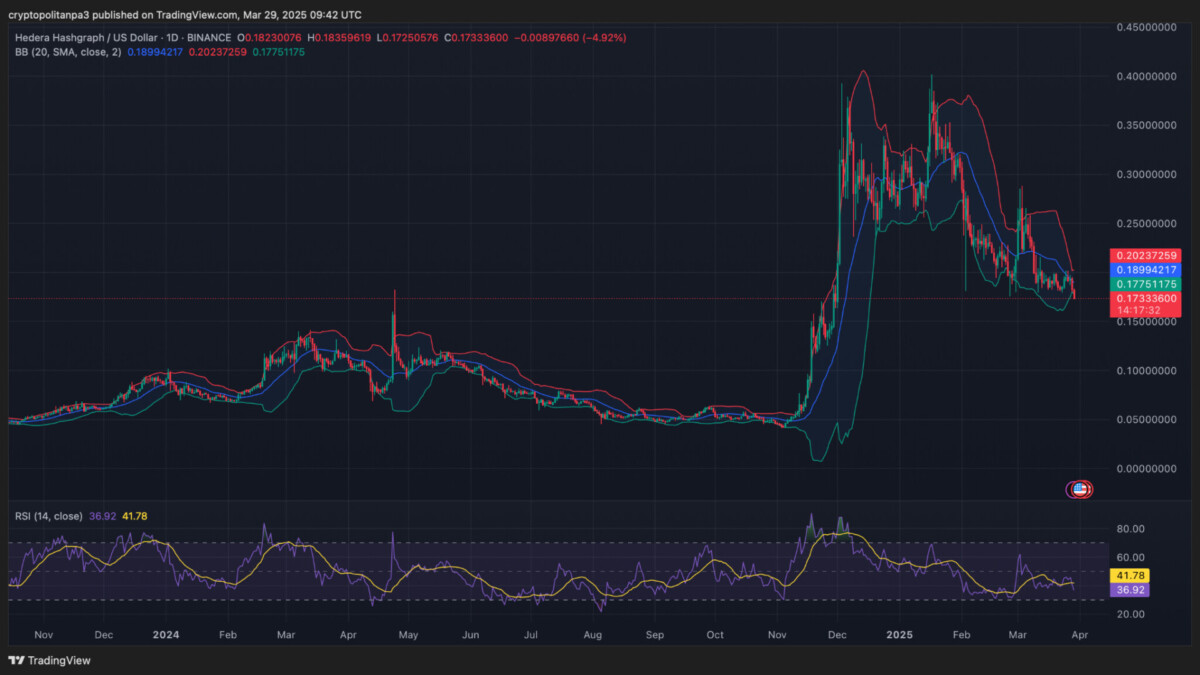
HBAR price analysis 1-day chart

Based on the 1-day chart for Hedera Hashgraph (HBAR) on March 29, the asset appears to be under sustained bearish pressure. The price is hovering near the lower Bollinger Band, indicating downward momentum and suggesting oversold conditions. RSI currently reads 36.92, aligning with bearish territory but not yet at extreme levels, implying there could be further room for a decline before a technical rebound. The narrowing Bollinger Bands reflect reduced volatility, often preceding a breakout. Unless the price reclaims support above the 20-day SMA (around $0.189), bearish sentiment may dominate. Traders should remain cautious as no strong reversal signals have emerged yet.
HBAR/USD 4-hour price chart

Based on the 4-hour chart for Hedera Hashgraph (HBAR), the technical indicators suggest bearish to neutral momentum. The price has dropped below the middle line of the Bollinger Bands and is testing the lower band, signaling downward pressure. The MACD line is slightly below the signal line, indicating fading bullish momentum or early bearish crossover. Meanwhile, the Balance of Power (BoP) is at -0.49, showing sellers currently hold the upper hand. Unless HBAR breaks back above the $0.18 resistance level or shows a reversal pattern, continued consolidation or mild decline may follow. Traders should watch for a volatility breakout.
What can you expect from the HBAR price analysis next?
Based on both the 4-hour and 1-day charts, Hedera Hashgraph (HBAR) is currently showing signs of continued bearish pressure. On the 1-day chart, the price is trending downward and hovering near the lower Bollinger Band, suggesting weakness in market sentiment. The RSI is below the midpoint, reflecting a lack of bullish momentum, and there are no clear signals of immediate reversal. On the 4-hour chart, the MACD histogram is slightly negative, while the Balance of Power indicator confirms seller dominance. Unless HBAR reclaims key resistance levels around $0.18, the short-term outlook remains bearish with potential for further consolidation or decline.
HBAR technical indicators: Levels and action
Simple moving average (SMA)
| Period | Value ($) | Action |
| SMA 3 | $ 0.219668 | SELL |
| SMA 5 | $ 0.20723 | SELL |
| SMA 10 | $ 0.203324 | SELL |
| SMA 21 | $ 0.20011 | SELL |
| SMA 50 | $0.243133 | SELL |
| SMA 100 | $ 0.251158 | SELL |
| SMA 200 | $ 0.18421 | SELL |
Daily exponential moving average (EMA)
| Period | Value ($) | Action |
| EMA 3 | $ 0.20347 | SELL |
| EMA 5 | $ 0.216788 | SELL |
| EMA 10 | $ 0.216788 | SELL |
| EMA 21 | $ 0.259919 | SELL |
| EMA 50 | $ 0.251068 | SELL |
| EMA 100 | $ 0.206699 | SELL |
| EMA 200 | $ 0.157196 | BUY |
Is HBAR a good investment?
Hedera Hashgraph distinguishes itself with its Hashgraph consensus algorithm, which promises higher speed, security, and scalability than traditional blockchain technologies. This positions HBAR as a potentially innovative player in distributed ledger technology, catering to various applications, including smart contracts and decentralized applications (dApps). These notable features could spur HBAR to new highs in the coming months and years, making it a profitable investment tool.
Will HBAR reach $1?
Hedera Hashgraph (HBAR) reaching $1 is possible but depends on several key factors, including market conditions, adoption rates, and overall crypto sentiment. HBAR has strong fundamentals with its fast, low-cost transactions and backing from major enterprises.
If adoption grows within industries like DeFi, NFTs, and enterprise applications, demand for HBAR could push prices higher. However, competition from other layer-1 blockchains and regulatory factors may slow its growth. A bullish crypto cycle and wider institutional interest would be necessary for HBAR to reach $1. While achievable, sustained utility and investor confidence are crucial for long-term price appreciation.
What will HBAR be worth in 2025?
By 2025, HBAR is expected to be worth $0.34
How much will HBAR cost in 2030?
By 2030, HBAR is expected to be worth $2.10
Can HBAR reach $20?
HBAR reaching $20 would require an extraordinary market rally and widespread adoption, making it highly unlikely in the near future. For context, with HBAR’s current circulating supply of around 33 billion tokens, a $20 price would push its market capitalization to $660 billion, placing it among the largest cryptocurrencies, rivaling Bitcoin and Ethereum.
Where to buy HBAR?
Traders and investors can buy Hederah Hashgraph (HBAR) on these CEXs: Binance, KuCoin, HTX, Bybit, Bitget, and others.
Will HBAR reach $10?
HBAR reaching $10 is highly unlikely, requiring a massive market cap increase. Predictions for 2030 estimate HBAR could reach between $2.23 and $2.65, making $10 an unrealistic target without extraordinary market changes
Will HBAR reach $100?
Hederah Hashgraph (HBAR) reaching $100 is highly ambitious and would require exceptional growth, widespread adoption, and wild market speculation.
Does HBAR have a good long-term future?
HBAR has the potential for a good long-term future if it continues to gain popularity and adoption. Analysts project a market price of about $0.34 by 2025 and $0.50 by 2030. However, as with all meme coins, its future is uncertain and highly dependent on market trends and community support.
Recent news/opinion on HBAR
- Nasdaq has applied to list an ETF holding Hedera’s HBAR token. This follows multiple filings by exchanges and asset managers seeking altcoin-based ETFs. The SEC must approve the listing before trading begins. In November, Canary Capital filed for its Canary HBAR ETF to provide investors exposure to Hedera’s native currency.
Hedera Hashgraph price prediction March 2025
The Hedera Hashgraph price prediction for March 2025 suggests a consistent projection, with potential prices ranging from a low of $0.21, an average of around $0.23, to a high of $0.24.
| Hedera price prediction | Potential Low ($) | Average Price ($) | Potential High ($) |
| Hedera price prediction March 2025 | $ 0.21 | $ 0.23 | $ 0.24 |
HBAR crypto price prediction 2025
By 2025, HBAR’s average market price is expected to be $0.30, with a potential low of $0.29 and a potential high of $0.34.
| Year | Potential Low ($) | Average Price ($) | Potential High ($) |
| 2025 | $0.29 | $0.30 | $0.34 |
Hedera Hashgraph forecast 2026-2031
| Year | Potential Low ($) | Average Price ($) | Potential High ($) |
| 2026 | $0.41 | $ 0.42 | $0.50 |
| 2027 | $0.57 | $0.59 | $0.72 |
| 2028 | $0.81 | $0.83 | $1.01 |
| 2029 | $1.19 | $1.24 | $1.39 |
| 2030 | $1.75 | $1.80 | $2.10 |
| 2031 | $2.56 | $2.63 | $3.04 |
HBAR price prediction 2026
In 2026, the price of a Hedera hashgraph (HBAR) is expected to range between $0.41 and $0.50, with an average of $0.42.
HBAR price prediction 2027
The 2027 forecast predicts HBAR will trade between $0.57 and $0.72, with an average price of $0.59.
HBAR price prediction 2028
In 2028, HBAR could experience a further climb, reaching a maximum of $1.01, with an average price of $0.83 and a minimum of $0.81, indicating market growth.
HBAR price prediction 2029
HBAR in 2029 is expected to stabilize, with prices holding between $1.19 and $1.39 and an average of $1.24. This period could represent consolidation as the network matures.
HBAR price prediction 2030
By 2030, Hedera is anticipated to show growth, with projected prices from $1.75 to $2.10 and an average of $1.80 suggesting market interest.
HBAR price prediction 2031
The forecast for 2031 projects HBAR reaching a maximum of $3.04, an average trading price of $2.63, and a minimum of $2.56

Hedera market price prediction: Analysts’ HBAR price forecast
| Firm | 2025 | 2026 |
| Coincodex | $0.35 | $0.15 |
| DigitalCoinPrice | $0.50 | $0.59 |
Cryptopolitan’s Hedera Hashgraph price forecast
According to Cryptopolitan, HBAR will reach a maximum price of $0.2744 by the end of 2025 and is expected to reach $0.4036 in 2026. Note that the predictions are not investment advice.
Hederah Hashgraph’s historic price sentiment

- The year 2019 started with a negligible price figure, which remained consistent for the initial months.
- Price trends fluctuated significantly throughout 2019, dropping to $0.01 by the end of 2019.
- HBAR opened the year 2021 at $0.03, remaining steady for the first few days.
- The price significantly increased to $0.1 by the first week of February 2021, driven by the continuous network efforts of early January.
- HBAR started 2024 modestly, surging in April to a high of $0.1793 before stabilizing around $0.110 in May and dropping to $0.051 by September.
- November saw a rebound, with HBAR reaching $0.3012 and $3.34B in trading volume, closing the year near $0.29 after peaking at $0.30 in December.
- In January 2025, HBAR is trading between $0.30 to $0.31.
- However, the closing price for HBAR in January was $0.3.
- As of February 2025, HBAR is trading between $0.25 and $0.26.
- HBAR value decreased further in March as it dipped to the $0.20 range.