XRP is sitting right on top of a very important zone around ‘$2.50 and traders are waiting to see what’s next. With a $140 billion market cap and $6.56 billion in 24-hour volume, XRP has been ranging from $2.38-$2.59 in the last 24 hours.
Could this be a springboard to more upside or a reversal? With everyone on both sides waiting to make their move, the levels and the broader trend in XRP are under the microscope.
Short-Term Consolidation Points to Measured Correction
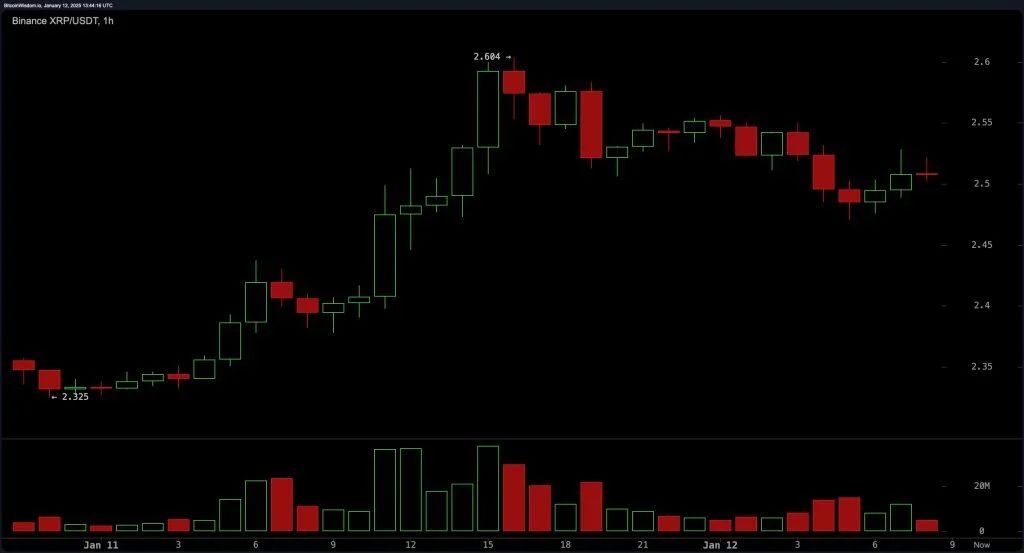
On the hourly chart, XRP was into micro-consolidation, firming up around $2.50 after touching a local high of $2.604. Resistance is between $2.55 and $2.60, support is at $2.45.
- Volume Analysis: The decreasing volume signals some sort of controlled correction and not a full blown bearish reversal.
- Trading Opportunities: For short-term traders, the $2.45 support level presents an attractive entry point, with potential exit targets between $2.60 and $2.65 if bullish momentum resumes.
Broader Trends: Where Does XRP Stand?
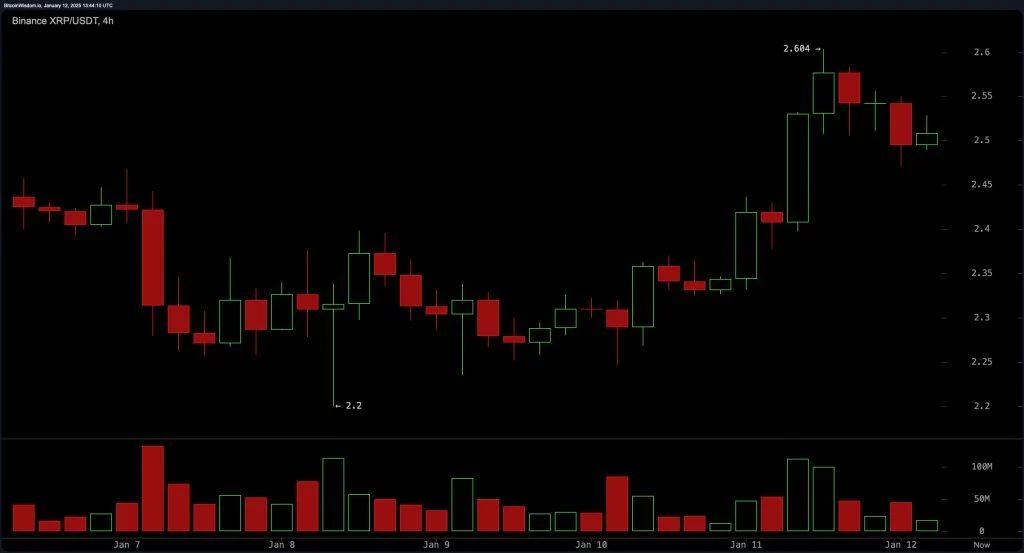
On the 4 hour chart, XRP has held the uptrend after the big rally at the start of the week.
- Resistance: Strong resistance zones are at $2.60 and $2.70.
- Support: The $2.45-$2.50 zone has been a key support zone for the bulls.
This trend might mean traders can play a breakout above $2.60 or a pullback to $2.45 based on volume and sentiment.
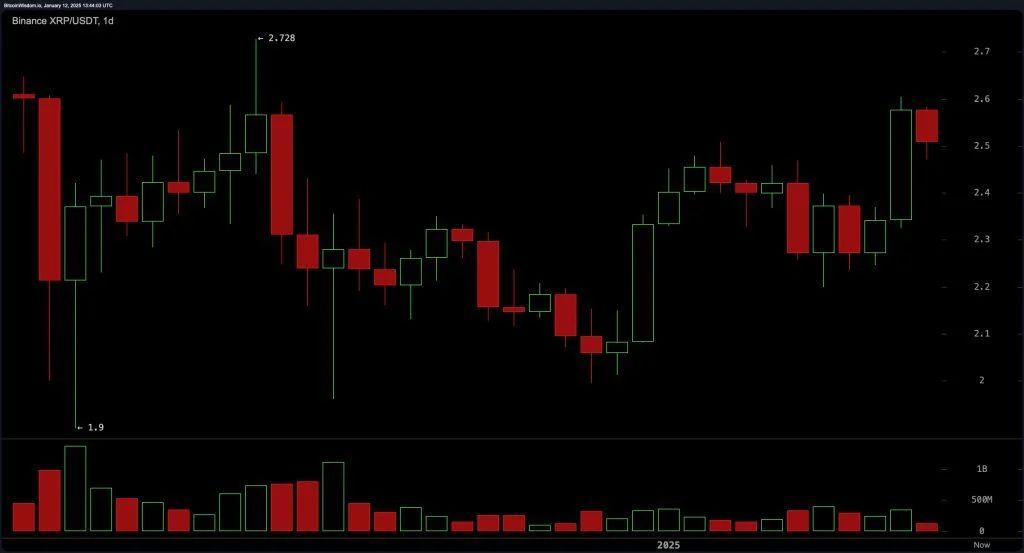
On the daily chart XRP is in a recovery pattern that has taken it from a recent low of $2.20 to an intraday high of $2.72 and then pulled back slightly.
Resistance and Support: Resistance is at $2.72; Support is at $2.40. More buying volume on the bullish candles indicates more interest in the asset in line with the broader recovery.


XRP Technical Indicators
XRP’s technical indicators show a mix of bullish and cautious signals:
- Relative Strength Index (RSI): At 58.99, the RSI indicates neutrality but with a bias toward bullish momentum.
- Stochastic Oscillator: With this oscillator reading at 82.71, this demonstrates overbought conditions and may be a call for caution by traders.
- MACD: The MACD is positive with a value of 0.07805 hence the trend continues to be beneficial. However, the negative value of the momentum oscillator at -0.10760 introduces a word of caution.
- Commodity Channel Index (CCI): At 137.10, the CCI flags overbought territory, therefore, caution around resistance levels should be paramount.
Across all timeframes, XRP’s moving averages (exponential and simple) across 10, 20, 50, 100, and 200 periods remain bullish. This tells of overall optimism by traders, provided XRP sails through critical resistance levels.


Bullish and Bearish Scenarios
Bullish Case:
Moving averages (MA) are aligned for upward momentum on all time frames, and recent volume is bullish. A break above $2.60 zone on good volume can take XRP to $2.70 and above.
Bearish Case:
Resistance between $2.60 and $2.70, combined with signals of overbought conditions, raises caution. Failure to hold the support line at $2.45 could have traders go deeper into correction as the $2.40 level becomes the next big test.
Market Sentiment: Is the Trend Your Friend?
XRP technicals are mixed, and prices are consolidating like the broader crypto market. MA’s are still bullish but Stochastic and CCI are cautionary.
A break above $2.60 with volume could shift sentiment in favor of bulls. Failure to clear the resistance zones could embolden the bears, especially if the $2.45 support is broken. Here are some strategic trading tips:
- Watch Volume: Volume is the key to confirming breakouts or breakdowns. Strong volume above $2.60 can mean more upside.
- Support zones to watch: Traders should keep an eye on XRP holds the support zones at $2.45 and $2.40 because if broken, it can lead to deeper correction.
- Risk and reward: Traders should use tight stop losses near support levels to limit the downside risk and target profit zones between $2.60 and $2.70 on uptrends.


Conclusion
XRP is at a crossroads, sitting near $2.50.While some bullish momentum and good technicals are seen, overbought conditions and strong resistance zones are cautionary.
Traders always have to be on the lookout, watching the incoming price levels and the volume movement and analyzing the overall market. Like every time, a carefully balanced approach giving importance to risk management is going to be important in navigating XRP’s next significant move.
The BIT Journal is available around the clock, providing you with updated information about the state of the crypto world. Follow us on Twitter and LinkedIn, and join our Telegram channel.
FAQs
1. What is the current trading range for XRP?
XRP is spanning $2.38-2.59 with consolidation at about the $2.50 level.
2. What are the major resistance and support zones for XRP?
Resistance is from $2.60 to $2.70 and strong support is at $2.45 and $2.40.
3. Where are the technicals pointing – up or down?
Technically, indicators are mixed where MA’s are bullish but Stochastic and CCI are cautionary.
4. What should traders watch for in XRP price action
Traders should watch volume to confirm a break above $2.60 or a break below $2.45.


