CaryptosHeadlines Media Has Launched Its Native Token CHT.
Airdrop Is Live For Everyone, Claim Instant 5000 CHT Tokens Worth Of $50 USDT.
Join the Airdrop at the official website,
CryptosHeadlinesToken.com
CaryptosHeadlines Media Has Launched Its Native Token CHT.
Airdrop Is Live For Everyone, Claim Instant 5000 CHT Tokens Worth Of $50 USDT.
Join the Airdrop at the official website,
CryptosHeadlinesToken.com
Kaspa (KAS) forms an ascending triangle, signaling a potential breakout above $0.085. Key levels, moving averages, and volume trends analyzed.


News
- Kaspa’s ascending triangle pattern with higher lows suggests increasing buying pressure, positioning the price for a possible bullish breakout soon.
- The 9-period EMA at $0.0777 and 50-period SMA at $0.0767 provide strong support, reinforcing the bullish market structure.
- A breakout above $0.085 with strong volume could push KAS toward $0.095-$0.10, while failure may lead to $0.070-$0.065 support zones.
Kaspa (KAS) is poised for a bullish breakout on the four-hourly chart. Alpha Crypto Signal highlighted on X that KAS is forming an ascending triangle pattern that has tremendous potential considering prevailing market conditions.
Ascending Triangle Pattern
The chart is in an ascending triangle formation with higher lows and a consistent resistance point of $0.085. The purple shading shows the formation of a triangle and forms an ABCD pattern that is typical of a consolidation before a breakout.
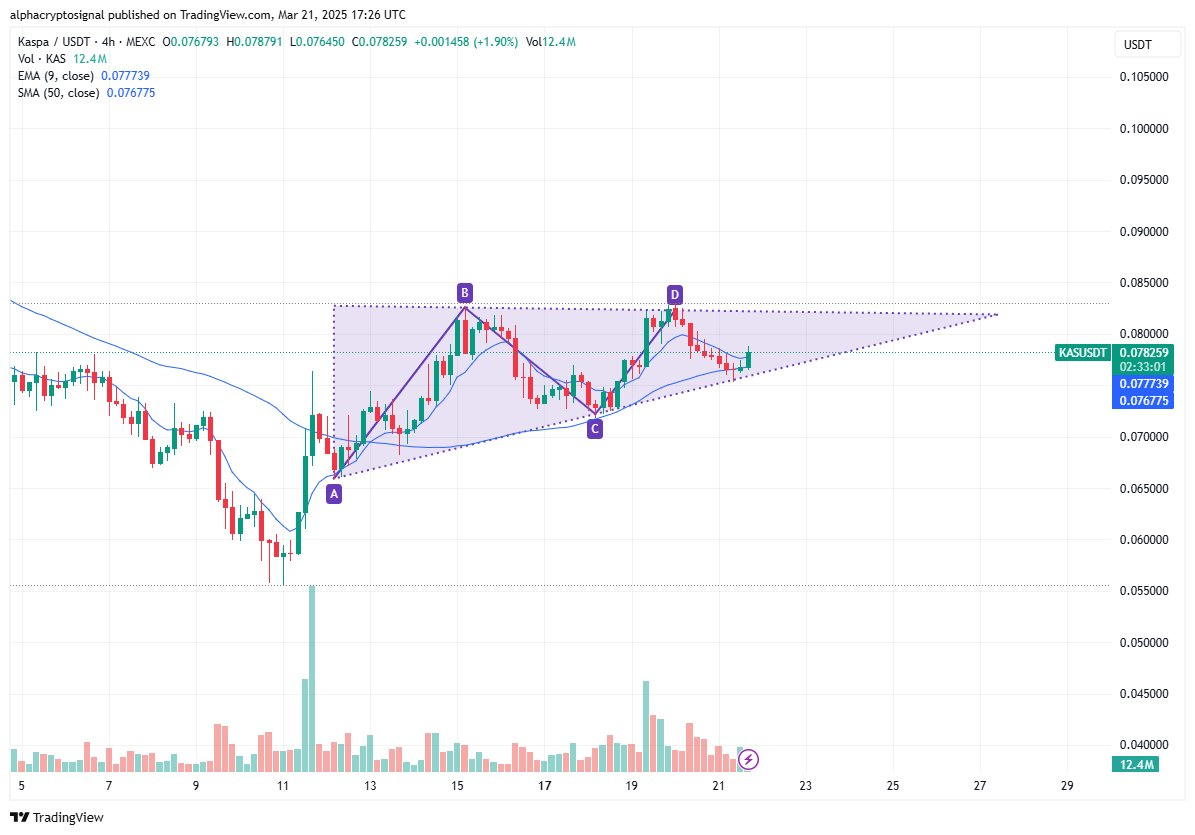
The resistance zone around $0.085 has been probed time and again on key levels, showing a stubborn supply point that buyers are having trouble penetrating. Increasing buyer participation is seen in higher and higher lows that form.
Moving Averages and Price Action
The short-term and long-term moving averages are significant in this arrangement based on the analysis. At $0.0777, the 9-period EMA is beneath the market price and signifies that short-term bulls are favored.
The $0.0767 50-period SMA has served as support and validates the formation of the ascending triangle. Price has been consistently bouncing off these averages indicating that there is still a stage of accumulation that can continue to propel prices higher.
Volume Analysis and Possible Scenarios
The volume patterns are registering increasing buying interest on the up move, although a definitive breakout has not been witnessed. Buyers are present as indicated by volume numbers, although the recent spurt in volume is still modest.
A breakout above resistance around $0.085 with decent volume can propel KAS to levels of $0.095 to $0.10. Or, a breakdown below this and a drop through the trendline support can take prices to $0.070 to $0.065 support levels.
The technicals show that if KAS can break out of the ascending triangle with significant volume, there can be a sustained bull run. Price action and technical charts are in favor of a bullish position while market participants are waiting for any trend direction changes. The technical review gives clear direction to those monitoring potential long positions in KAS.