 CaryptosHeadlines Media Has Launched Its Native Token CHT.
Airdrop Is Live For Everyone, Claim Instant 5000 CHT Tokens Worth Of $50 USDT.
Join the Airdrop at the official website,
CryptosHeadlinesToken.com


The crypto world is keeping a keen eye on Mantra (OM), a token that has piqued the interest of many traders. The token has been stuck in a range close to significant levels after a strong breakout this year, allowing guesses about its direction. Traders, however, are more interested on the charts to see if OM’s price will continue its upward movement or else retrace back.
Breakout Marks a Shift in Market Structure
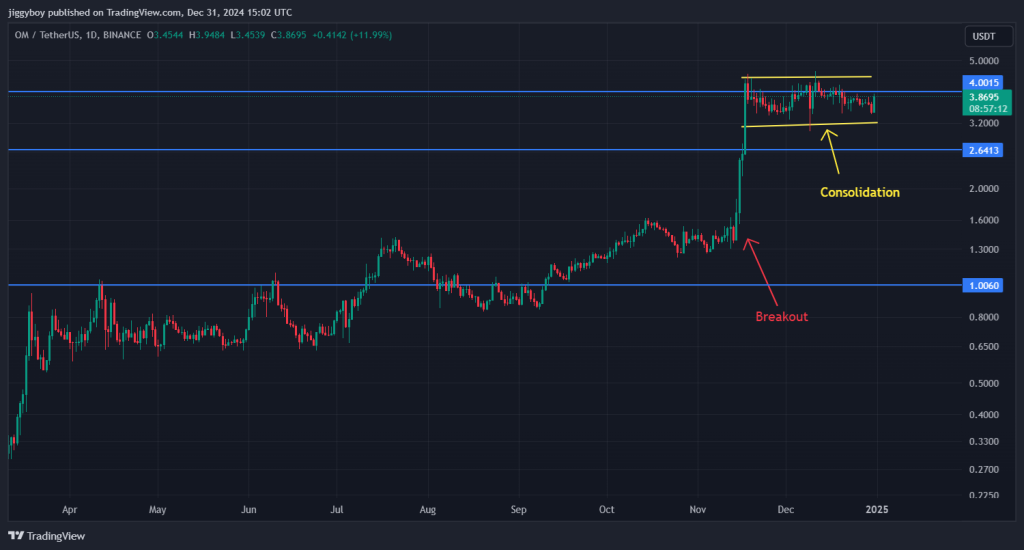
OM’s breakout from the $1.00 level in November signaled the start of a bullish phase. This level had previously served as a significant resistance for much of the year. Once surpassed, the price surged rapidly, driven by increased trading volume and strong buying activity. This upward momentum propelled OM into a clear uptrend, with the token achieving higher highs and higher lows.
The rally pushed OM’s price toward $4.00, marking a dramatic shift in market sentiment. The $1.00 level now acts as a strong support zone, reflecting a reversal of earlier resistance. Analysts have pointed out that this rally has established a bullish foundation for OM.
Read Also: PEPE Price is Getting Ready for a Massive Breakout—Elite Analyst Reveals Whales Are Buying the Dip!


Consolidation Phase Between $3.20 and $4.00
After the strong breakout, Mantra entered a period of price consolidation between $3.20 and $4.00. This range reflects a balanced battle between buyers and sellers as the market digests recent gains. After a breakout, consolidation phases often serve as points of pause for respondents during a retracement of the trend. Even while they do, they could signal a change in dominance.
The picture going forward is that $4 would be a make or break point. For instance, clues have indicated that $3.20 has bounced of several times indicating that there is strong support. When looking at the boundaries it can be seen that a close above support tends to lead to upside moves. In situations where there is trading below, this would lead to claims being made by sellers.
Read Also: Price Pattern That Triggered Solana’s (SOL) Last Massive Rally Reemerges: Will History Repeat?
Key Levels and Chart Patterns to Watch
The rectangle pattern formed during the consolidation phase highlights the importance of the $3.20–$4.00 range. This pattern often precedes significant price movements, making it a critical area to watch. OM’s price may reach the $5 mark if it manages to punch through the $4 mark, as can be inferred from other psychological markers.
In contrast, a breach of the $3.20 mark would see a retest of the lower support, in the range of $2.64 or $2.00. OM’s price action remains a focal point for market participants as they await its next major move.
Follow us on X (Twitter), CoinMarketCap and Binance Square for more daily crypto updates.
Get all our future calls by joining our FREE Telegram group.
We recommend eToro
Active user community and social features like news feeds, chats for specific coins available for trading.
Wide range of assets: cryptocurrencies alongside other investment products such as stocks and ETFs.
Copy trading: allows users to copy the trades of leading traders, for free.
User-friendly: eToro’s web-based platform and mobile app are user-friendly and easy to navigate.
Source link


