and Lightchain AI Still Impress in 2025? Indicators Are Giving Mixed Signals")


 CaryptosHeadlines Media Has Launched Its Native Token CHT.
Airdrop Is Live For Everyone, Claim Instant 5000 CHT Tokens Worth Of $50 USDT.
Join the Airdrop at the official website,
CryptosHeadlinesToken.com
CaryptosHeadlines Media Has Launched Its Native Token CHT.
Airdrop Is Live For Everyone, Claim Instant 5000 CHT Tokens Worth Of $50 USDT.
Join the Airdrop at the official website,
CryptosHeadlinesToken.com

- Shiba Inu long-term holders have accumulated 786.24 trillion SHIB, marking an all-time high.
- Despite market turbulence, SHIB is showing signs of potential recovery, with key resistance at $0.00001450–$0.00001550.
Shiba Inu has seen a shift in investor behavior in which long-term holders have been accumulating at a record pace. On-chain data from IntoTheBlock confirms that wallets holding SHIB for over a year now control 786.24 trillion tokens, a significant milestone for the ecosystem.
This steady accumulation comes even as short-term traders have been exiting their positions amid market fluctuations. The decline in holdings among short-term investors is notable.

Short-term holders of SHIB, who held it for less than a month, lost 42.73% of their holdings over the past week. Similarly, holders who held it between one and twelve months have cut stakes by 14.91%.
However, holders who have been holding it long-term have increased holdings by 5.73%, indicating confidence in the future prospects of the asset.
The pattern is comparable to the build-up period that occurred before SHIB’s late 2024 price surge. Hodlers added 747.06 trillion to 784.64 trillion SHIB in holdings between November 30 and December 4, 2024. Short-term traders shed some positions within the same time frame, as is common with current patterns.
SHIB Whales Sold Strategically After Accumulating 20%
Glassnode has recently pointed out how the first buyers of SHIB bought far over 20% of the supply at discounted levels before offloading at highs in a strategic fashion.
Early $SHIB holders accumulated over 20% of supply at low prices before selling at key price peaks.
This mass exit triggered sharp corrections, highlighting how concentrated early ownership can amplify volatility.
Tracking these movements helps traders anticipate market tops. pic.twitter.com/7m6PsGKqXp— glassnode (@glassnode) March 17, 2025
This has previously led to corrections, as huge sell-offs create volatility. Following the movements is useful in allowing traders to anticipate changes in sentiment within the markets.
SHIB is attempting to come back from a long-term downward trend. The token is trading at $0.00001228, up 4% over the past week yet still 24% below where it stood a month ago.
[mcrypto id=”12321″]
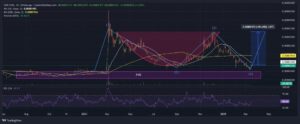
The chart indicates that SHIB has been moving in a descending wedge pattern, which is generally seen as a bullish reversal pattern. If current levels of support hold, it might be on the verge of reversing trend.
One of the key areas of resistance is between $0.00001450 and $0.00001550, corresponding to the 0.618 level of the Fibonacci retracement.
Historically, it has acted as both a support and resistance level, and it is a decision-making point of significance for SHIB’s price action. If it breaks out, the token might head to higher targets.
Shiba Inu’s Path to a 145% Surge Hinges on Key Levels
Market signs indicate that SHIB is on the verge of undergoing a larger rally. The token is observed to be constructing a Wave (5) rally, which could drive its price by 145% above current values.
If SHIB rises above $0.00001493, the 50-day Simple Moving Average (SMA), it could test $0.00001916, the 200-day SMA.
A successful breakout over $0.000020 could be followed by a rise to $0.000035, a level it has previously traded at on high momentum. If SHIB fails to hold on to support, a decline to around $0.00000753 remains possible.
The current market structure is a battle between bulls and bears. Short-term traders sell-off, adding volatility to the price, as long-term investors continue to build up.