Stuck Between US and EU, Analysts Warn!")


 CaryptosHeadlines Media Has Launched Its Native Token CHT.
Airdrop Is Live For Everyone, Claim Instant 5000 CHT Tokens Worth Of $50 USDT.
Join the Airdrop at the official website,
CryptosHeadlinesToken.com
CaryptosHeadlines Media Has Launched Its Native Token CHT.
Airdrop Is Live For Everyone, Claim Instant 5000 CHT Tokens Worth Of $50 USDT.
Join the Airdrop at the official website,
CryptosHeadlinesToken.com

- Solana’s economic value drops 90%, driven by declining meme coin activity and lower trading volumes, signaling potential further declines.
- Technical indicators show a bearish trend for Solana, with key support levels tested and RSI signaling oversold conditions.
Solana (SOL) has recently witnessed a drop in its economic value, declining by 90% from its previous peak. Despite this decline, the cryptocurrency holds above the $120 mark, leading to speculation about a possible rebound. However, analysts are sounding alarms about Solana’s future, citing several concerning factors that could lead to further declines.
After a short recovery above the $120 mark, Solana is currently trading at $123.94 as of the time of writing. The token saw a 5.98% surge on March 11, breaking a five-day streak of losses.
However, this rally is seen as temporary, with analysts warning that Solana may be unable to build a lasting bullish trend. The price remains below its previous resistance level of $130, and a slight intraday pullback of 1.14% further emphasizes the current instability.
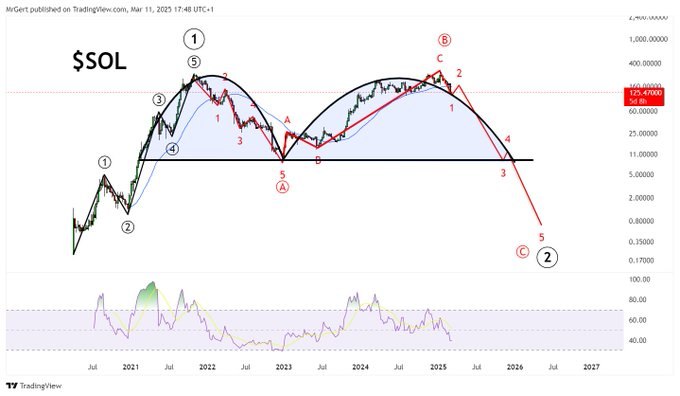
According to ETHNews, Solana has experienced a 60% drop from its all-time high of $295. This decline has been accompanied by a “death cross” event, where the 50-day and 200-day extended moving averages (EMA) crossed bearishly. This event implies the possibility of further downward momentum, especially with the 100-day and 200-day EMAs nearing a bearish crossover.
Declining Real Economic Value and Meme Coin Activity
One reason for Solana’s economic value reduction is the decline in meme coin trading. Brandon Farmer, an analyst at ZeroKnowledge Polygon, noted that Solana’s earlier surge in real economic value (REV) was driven by speculative meme coin trading. During the meme coin boom, the Solana network saw an influx of trades, which increased transaction volumes and demand for block space.
You don’t hear as much about Solana REV justifying its market cap – this is because weekly REV is down 90% from ATH.
I wrote about this a while ago (link below).The problem is that the types of activity that are great for generating REV (memecoin trading!) are generally… pic.twitter.com/j08J9yr1uj
— Brendan Farmer (@_bfarmer) March 11, 2025
However, with the decline in meme coin trading, the network’s REV has dropped by 90%, reducing its ability to generate sustainable transaction fees. The decrease in meme coin activity has led to lower trading volumes, directly impacting Solana’s market performance.
However, Solana’s price chart shows several bearish signs that suggest the possibility of further declines. Technical analyst Gert van Lagen highlighted a double-top formation on the weekly chart, often a reversal signal. The rising non-vote transaction rate, now at 75%, adds to the bearish outlook, indicating growing discontent with Solana’s network.
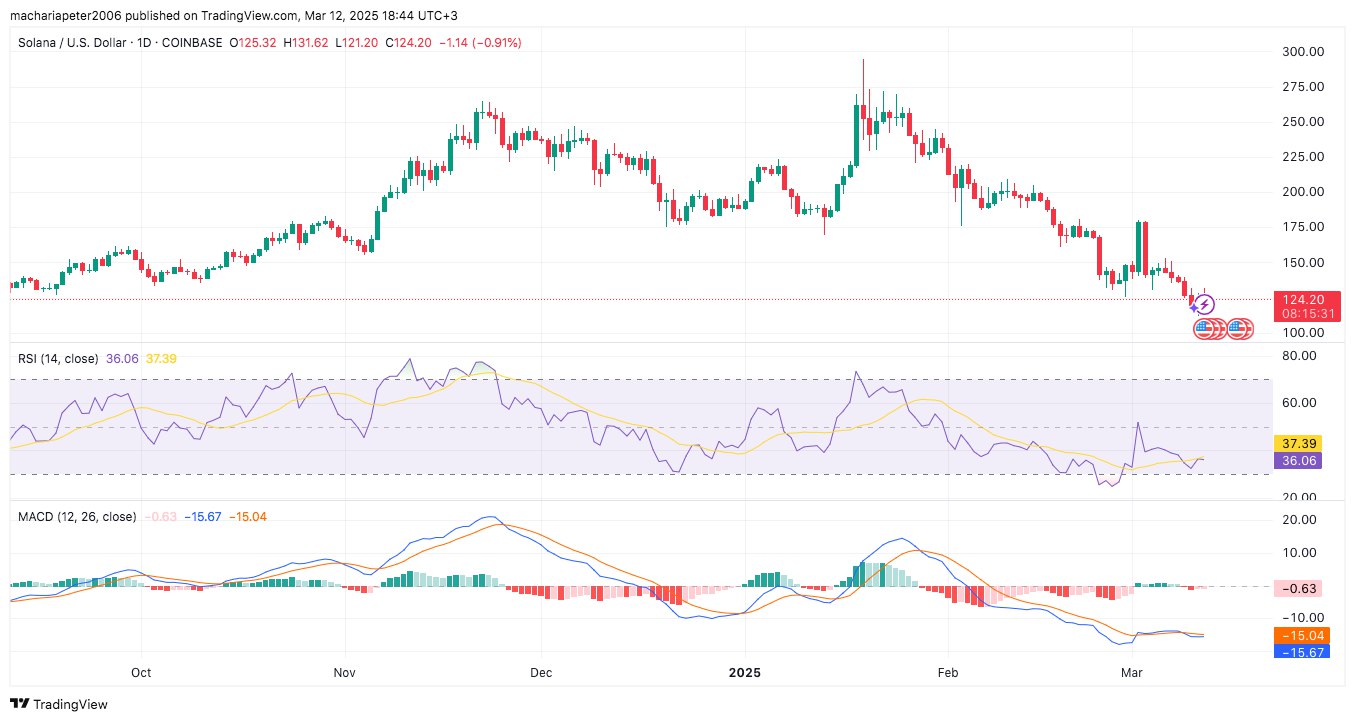
Additionally, technical indicators such as the Relative Strength Index (RSI) and the Moving Average Convergence Divergence (MACD) suggest that Solana is currently in a bearish phase.
The RSI is at 36.06, indicating oversold conditions, but it remains well above the typical 30-level threshold for a potential reversal. The MACD indicator shows a bearish trend, with the MACD line below the signal line, further reinforcing the likelihood of continued downward momentum.
While Solana is currently trading above $120, its outlook remains uncertain. The decline in meme coin trading, combined with bearish technical indicators, suggests that the digital asset may continue to struggle in the short term.