 CaryptosHeadlines Media Has Launched Its Native Token CHT.
Airdrop Is Live For Everyone, Claim Instant 5000 CHT Tokens Worth Of $50 USDT.
Join the Airdrop at the official website,
CryptosHeadlinesToken.com
The TRUMP Meme coin has been under intense scrutiny lately. Despite an overall bearish market structure, technical signals hint at the possibility of a short-term 10% price bounce. While the long-term bias remains cautious, recent price action and divergence in momentum indicators are sparking fresh optimism among technical analysts.
Re-examining TRUMP’s price dynamics using updated liquidity heatmaps, divergence signals, and key support/resistance levels; we bring together expert insights, fresh perspectives, and robust technical analysis to assess whether a meaningful bounce could be imminent.
Unpacking the Price Action: A Tale of Reversals and Divergence
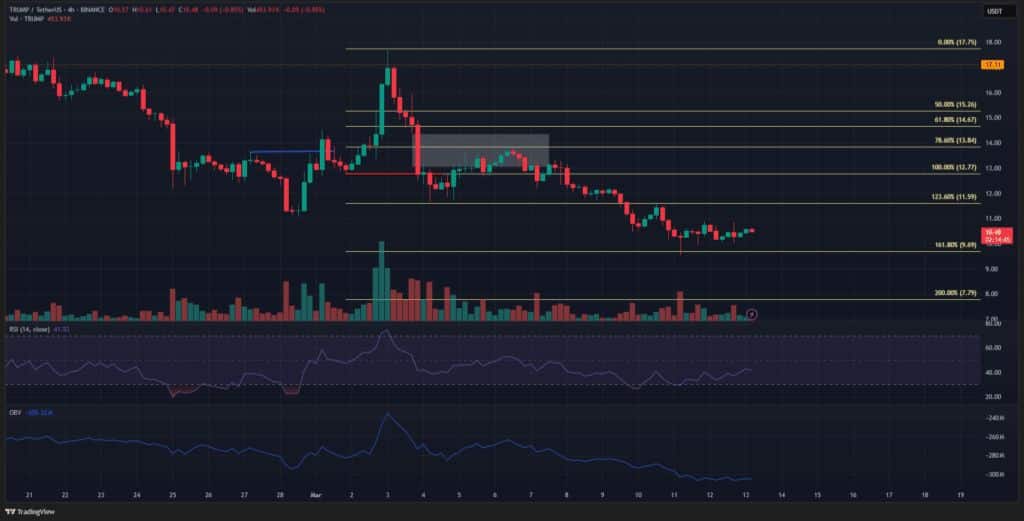
A $13.84 resistance zone reversal has characterized TRUMP’s recent price activity. Earlier analysis by experts predicted that the $14-level would continue to challenge the bulls, and market action has largely confirmed this view. Now, attention has shifted to the 23.6% extension level at $11.59, which has flipped from support to resistance, signaling that the asset might be due for a short-term bounce if this level holds.
To summarize the crucial levels:
| Key Level | Role | Implication |
|---|---|---|
| $13.84 | Major Resistance | Current reversal point; a break above may signal trend change. |
| $11.59 (23.6% ext.) | New Resistance | A potential ceiling for short-term gains; a 4-hour close above may indicate a bullish shift. |
| $11.00 | Liquidity Cluster | Area of heavy liquidation; price may revisit here before a rebound or further drop. |
| $10.00 | Critical Downside Zone | Target if selling pressure persists and liquidity is collected here. |
One of the most compelling signals has been the emergence of bullish divergence on the Relative Strength Index (RSI). Despite an overall bearish structure; with the On-Balance Volume (OBV) trending downward; TRUMP’s RSI has started to decouple from the falling price, suggesting that buyers might be gathering momentum.
An analyst noted:
“While the OBV continues to underline the selling pressure, the bullish divergence in the RSI is our early warning that the selling may be exhausting itself.”
This divergence, though subtle, adds an element of hope for those expecting a temporary bounce. Yet, caution remains paramount, given the prevailing bearish swing structure.


Liquidity Heatmap and Liquidation Insights: Where is the Money?
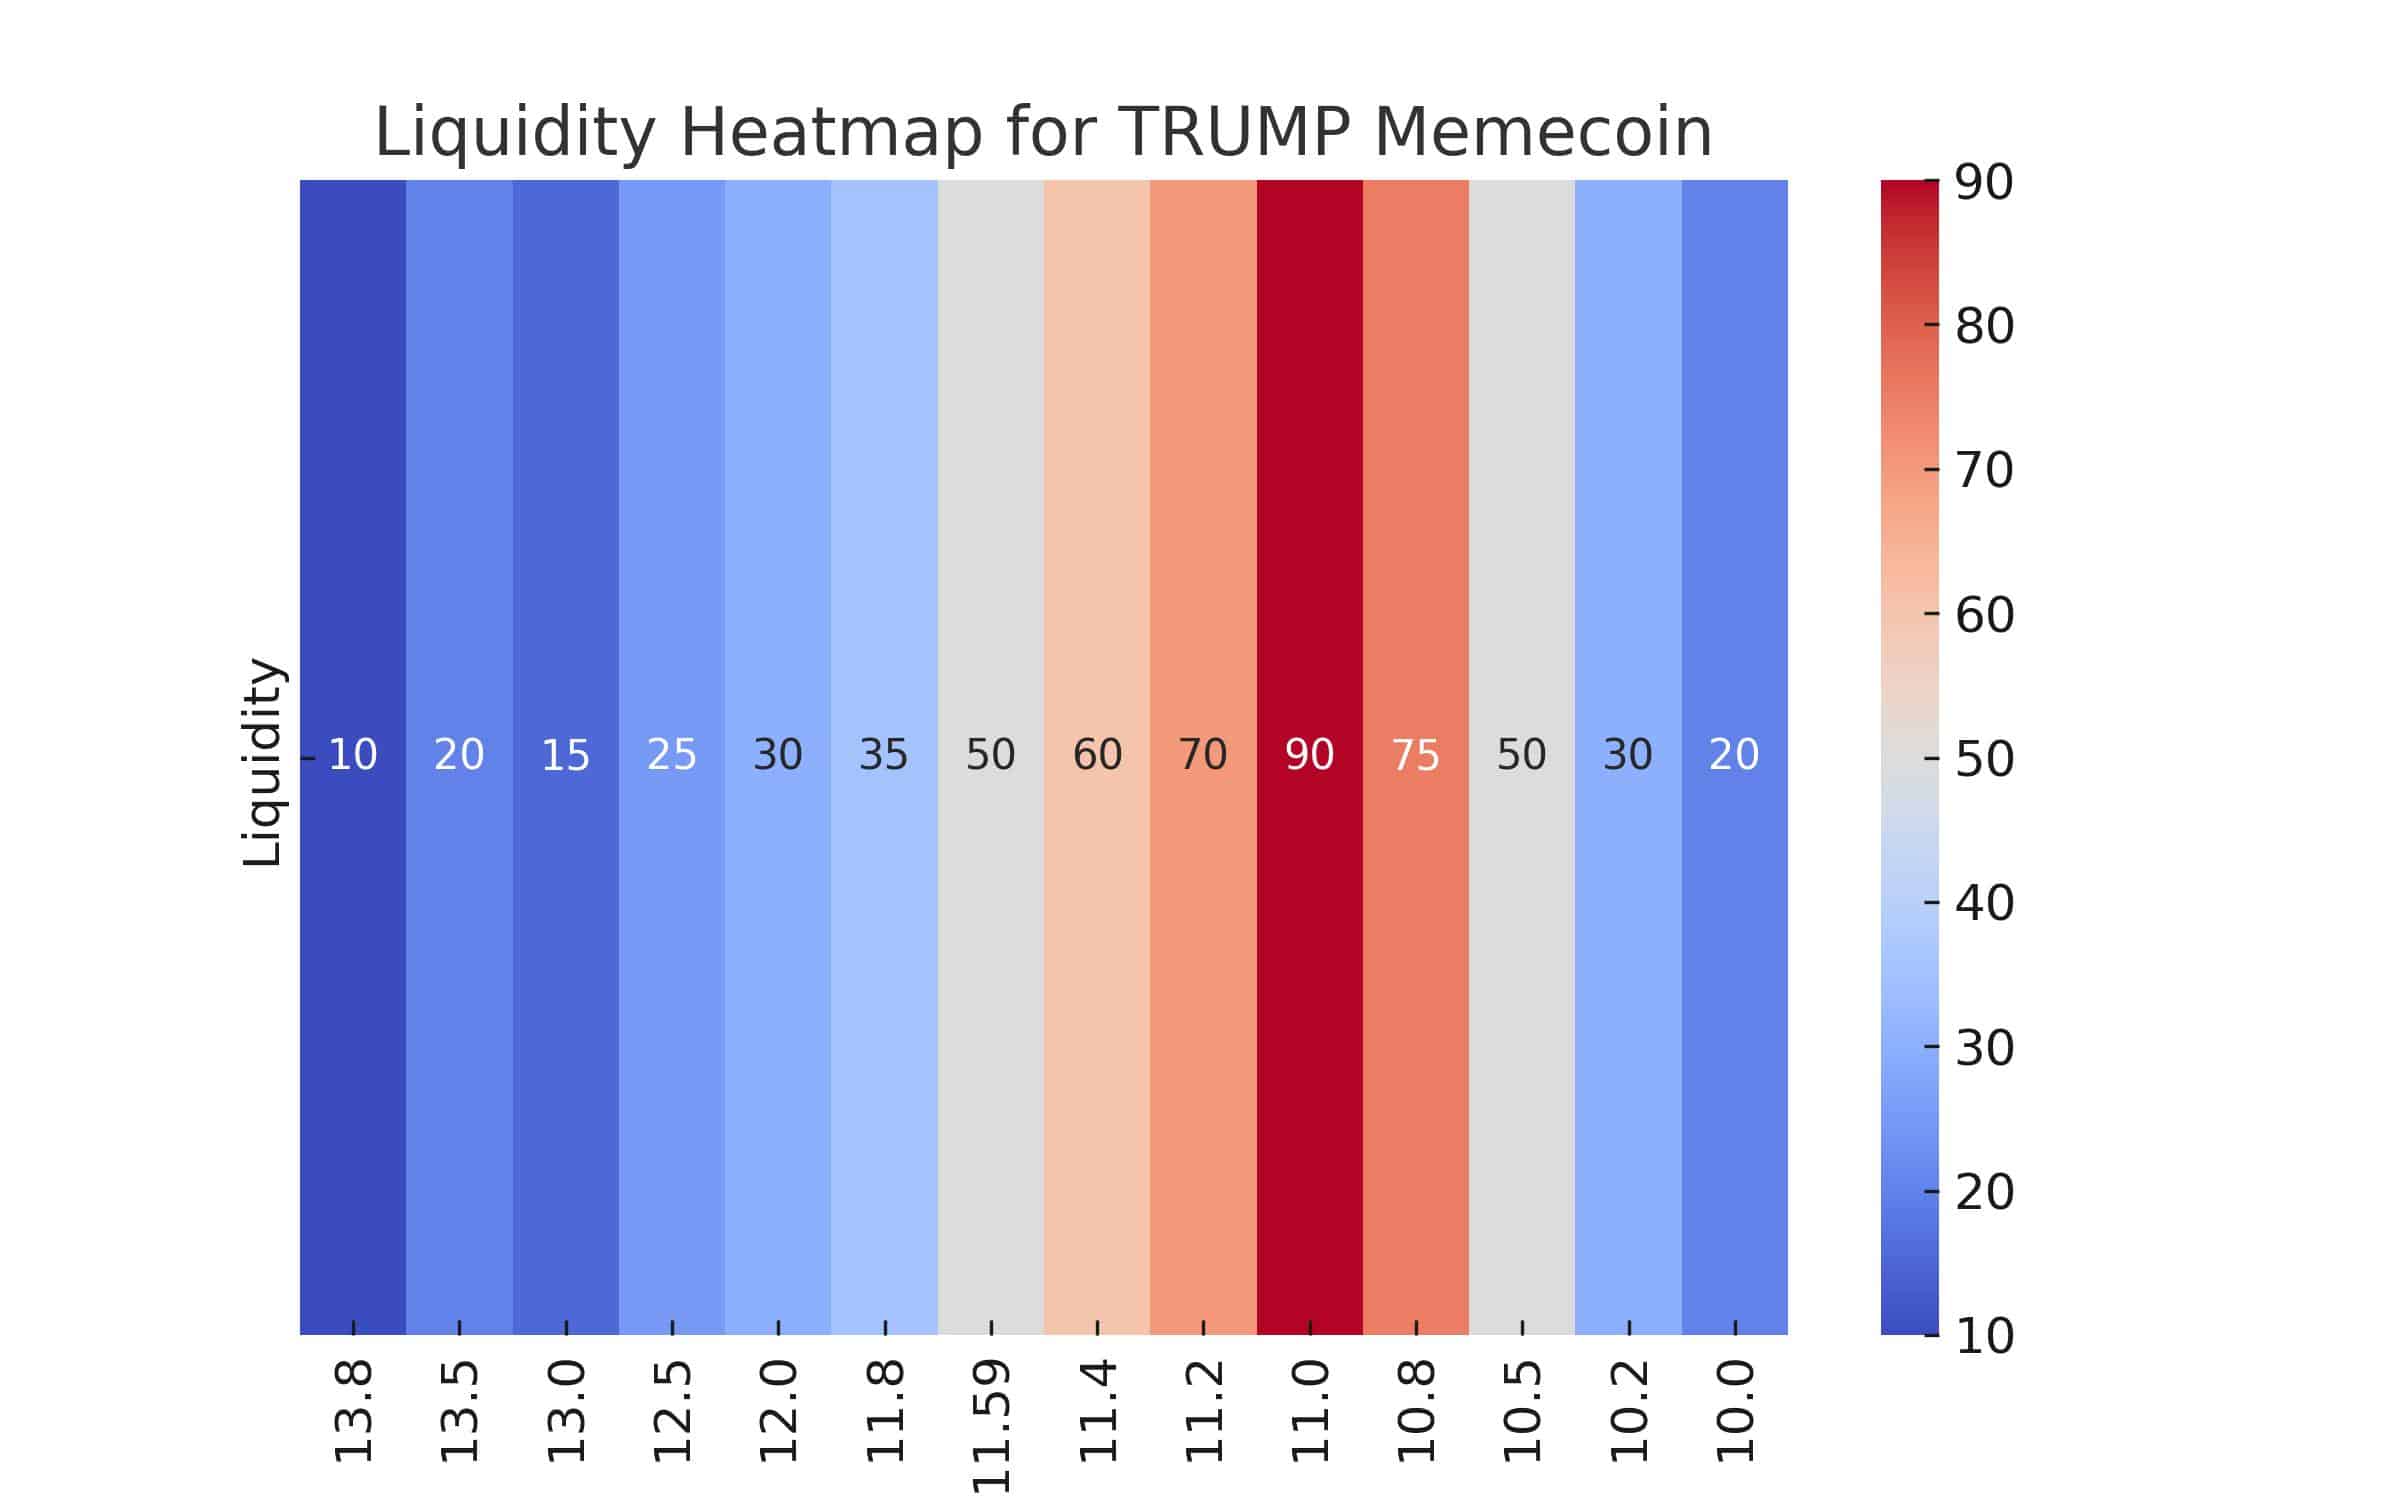
Recent data from a 1-week liquidity heatmap reveals significant clusters of liquidation orders around the $11 level. These clusters are a double-edged sword:
- Short-Term Opportunity: They suggest that there may be a rebound if buyers step in to collect the liquidity at these lower price levels.
- Short-Term Risk: However, these same clusters can also indicate that if the price doesn’t hold, the asset could see further downward pressure as stop-loss orders are triggered.
The heatmap data suggests that an initial bounce may bring the price up to around $11.59, but without sustained buying, the momentum may falter.
While liquidity and price dynamics offer technical clues, broader market sentiment is equally critical. Recent trading volumes indicate increased participation, hinting that institutional players might be quietly accumulating during the dip. However, the overall sentiment remains cautious, with many traders reluctant to take long positions until a clear reversal is confirmed.


Expert Opinions on TRUMP Memecoin’s Future
Industry voices have weighed in with their perspectives on TRUMP’s technical setup. Here are some key expert insights:
- Crypto Analyst “MarketPulse” commented on a leading financial forum, stating:
“The emerging bullish divergence is noteworthy. If TRUMP can close a 4-hour session above $11.59, we could see a 10% rebound. However, the overall bearish structure means that traders should remain cautious.”
- Technical Strategist Jane Kim from a prominent crypto research firm noted:
“We are observing classic signs of short-term recovery in high-volatility assets like TRUMP. While the broader downtrend remains, a short-term bounce to the recent lower high is not uncommon. Strategic entries on confirmations are key.”
- Institutional Investor Insight: A senior trader at a digital asset hedge fund remarked anonymously:
“Liquidation clusters at $11 are significant. If the price can stabilize and show buying pressure at that level, it might trigger a temporary bounce. But the risk of a deeper dive is real if key resistance isn’t broken.”
These insights, drawn from a mix of independent research and institutional commentary, underscore the uncertainty and potential of TRUMP Memecoin’s short-term movements.
Scenario Analysis: What’s Next for TRUMP Memecoin?
Given the technical indicators and market sentiment, we can outline two primary scenarios:
Scenario A: The 10% Bounce Materializes
- Trigger: A confirmed 4-hour candle close above the $11.59 resistance level.
- Outcome: Short-term rebound lifts the price to between $12 and $12.5, driven by a squeeze as buyers enter to capture liquidated positions.
- Indicators: A reversal in the RSI trend accompanied by stabilization of OBV could support this scenario.
- Implication: This rebound could provide short-term relief to bullish traders, though the overall structure remains bearish.
Scenario B: Continued Downward Pressure
- Trigger: Failure to hold above $11.59, with persistent selling pressure near the $11 liquidity cluster.
- Outcome: The price declines further toward the $10 level, as liquidation orders cascade.
- Indicators: Sustained bearish OBV and lack of decisive bullish momentum on the RSI would confirm this scenario.
- Implication: Traders should consider risk management strategies, as further declines may lead to deeper corrections.
Strategic Considerations: Trading Amid Volatility
For the Cautious Trader
- Wait for Confirmation: Do not enter long positions until a clear 4-hour session close above $11.59 is observed.
- Set Tight Stop-Losses: Given the volatile environment, risk management is critical. Consider stop-loss orders just below key support levels.
- Monitor Volume: Look for increasing volume on rebounds as a sign of genuine buying interest.
For the Aggressive Trader
- Buy the Dip: Some may choose to accumulate at the $11 level, anticipating that the current volatility will eventually trigger a rebound.
- Position Sizing: Given the high risk, it’s advisable to keep positions small relative to the overall portfolio.
- Be Ready to Exit: Watch for key reversal signals such as a breakout above $11.59 to take profits or shift to a longer-term strategy.
Macro Context: External Factors Influencing TRUMP Memecoin
While our analysis focuses on technicals, broader market conditions play a vital role. In times of heightened volatility:
- Market Liquidity: Overall liquidity in the crypto market can influence price movements, especially for speculative assets.
- Investor Sentiment: General risk aversion or optimism in broader markets can either dampen or fuel short-term bounces.
- External News: Any major developments, regulatory news, or shifts in institutional sentiment could rapidly change the outlook for TRUMP.
It is crucial for traders to integrate these macro factors with technical signals when making decisions.
Conclusion: A Moment of Opportunity or Caution?
TRUMP Memecoin’s current technical landscape presents a complex picture. While the asset shows signs of a possible 10% bounce; highlighted by bullish divergence and liquidity signals; the underlying bearish structure and concentrated liquidation clusters underscore significant risks.
For now, the market waits for a decisive confirmation above the critical $11.59 level. Until then, traders are advised to remain cautious, manage risk meticulously, and monitor both technical indicators and broader market conditions.
This analysis is a call for strategic patience: the potential rebound could provide a timely opportunity for those prepared to act on confirmed signals, but the risk of further declines remains high. As always, in the volatile realm of memecoins, staying informed and nimble is the key to success.
The BIT Journal is available around the clock, providing you with updated information about the state of the crypto world. Follow us on Twitter and LinkedIn, and join our Telegram channel.
FAQs
1. What is the key technical level for a potential TRUMP Memecoin bounce?
The critical level is $11.59, which, if closed above on a 4-hour session, could signal a short-term rebound.
2. What indicators suggest a potential 10% bounce?
A bullish divergence in the RSI, along with the liquidity heatmap indicating a cluster around $11, suggests that a rebound may be imminent if buying pressure increases.
3. What are the risks if TRUMP Memecoin fails to break above $11.59?
Failure to maintain support at $11.59 could trigger further declines, potentially pushing the price toward the $10 level, as concentrated liquidations take effect.
4. How should traders approach this volatile environment?
Traders should adopt tight risk management strategies, wait for confirmation signals, and consider using stop-loss orders near key support levels.
5. What broader factors could impact TRUMP Memecoin’s price action?
External factors such as overall market liquidity, investor sentiment, and major regulatory or macroeconomic news can influence the short-term trajectory of TRUMP.
Glossary
Bullish Divergence: Occurs when a momentum indicator (like RSI) trends upward while the asset price falls, indicating a potential reversal.
Liquidity Heatmap: A tool that visualizes areas of concentrated buy or sell orders, indicating where significant liquidations might occur.
Resistance Level: A price point where selling pressure is expected to prevent further upward movement.
Support Level: A price point where buying interest is expected to prevent further downward movement.
OBV (On-Balance Volume): A technical indicator that uses volume flow to predict price changes.
Fair Value Gap: An area on a price chart where little or no trading has occurred, often indicating potential support or resistance.
References
Disclaimer
This article is for informational purposes only and should not be considered financial advice. Cryptocurrency investments are subject to market risk, and past performance does not guarantee future results. Investors should conduct their own research and consult with a financial professional before making any investment decisions.


