, Experts Predict 10x Multiple By Q3")


 CaryptosHeadlines Media Has Launched Its Native Token CHT.
Airdrop Is Live For Everyone, Claim Instant 5000 CHT Tokens Worth Of $50 USDT.
Join the Airdrop at the official website,
CryptosHeadlinesToken.com
CaryptosHeadlines Media Has Launched Its Native Token CHT.
Airdrop Is Live For Everyone, Claim Instant 5000 CHT Tokens Worth Of $50 USDT.
Join the Airdrop at the official website,
CryptosHeadlinesToken.com
- Analyst suggests that XRP could range between $9.7 and $27 per coin
- 2017-2018 bull run is taken into consideration where XRP surged by 718%
- Analysis relies heavily on established technical chart patterns and historical price behavior, but caution is advised
A crypto analyst going by the name EGRAG CRYPTO says XRP can hit $27 this bull run, basing this on the cryptocurrency’s past performances to get to that conclusion.
The technical analysis-driven projection for XRP’s price over the next month suggests that XRP could range between $9.7 and $27 per coin.
XRP Price Prediction: Ambitious Targets
That is a big jump, but the analyst’s post points out that crypto markets move in cycles and that a strong narrative is good enough to trigger a price rally. Case in point: Elon Musk adding BTC to Tesla’s balance sheet last cycle, but other companies not following.
However, these narratives eventually fade, and recognizing the cyclical nature of the market is key. The analysis also implies that while hype can drive prices temporarily, it’s the underlying market cycles that dictate long-term movements.
Accompanied with an XRP chart, EGRAG CRYPTO points out two price targets, the first one being the midpoint of the triangle.
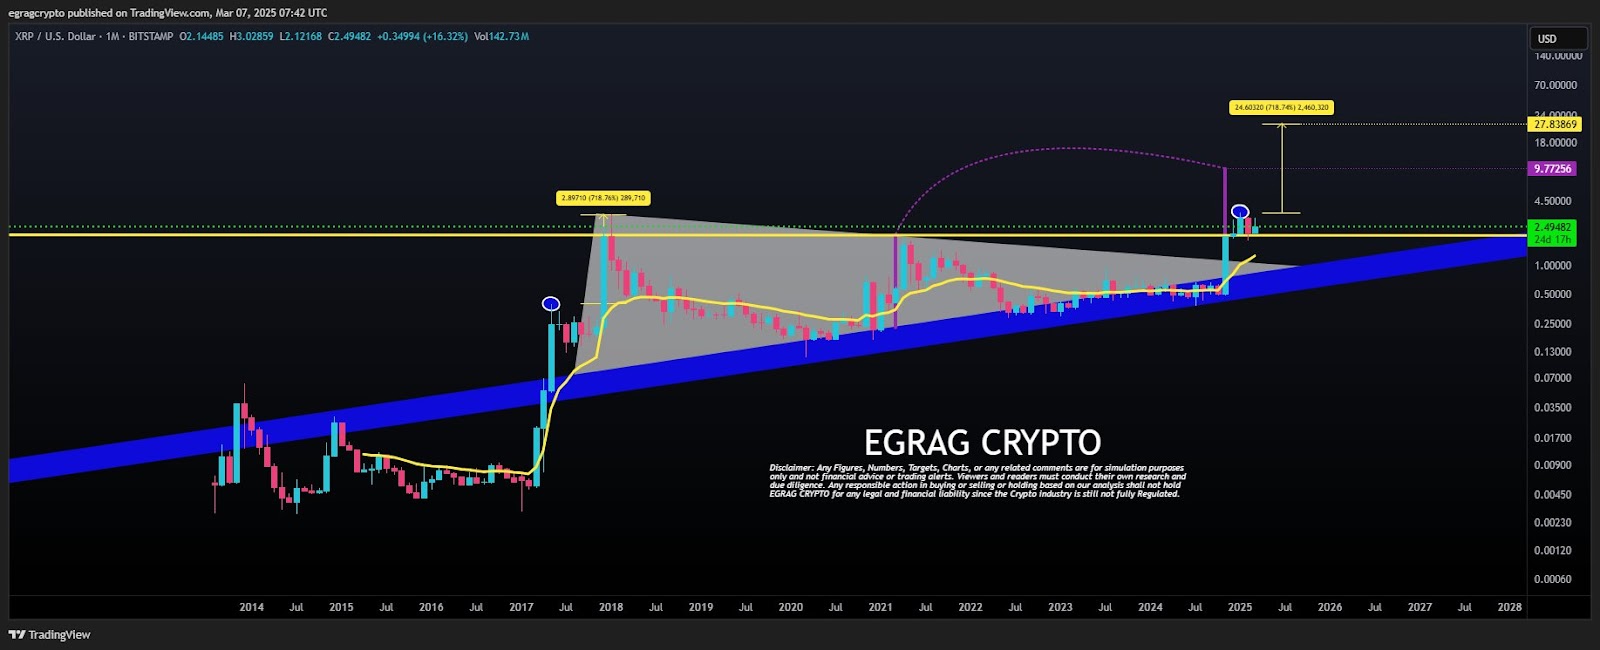
They estimate that if XRP breaks out from its current consolidation phase, it could reach around $9.7, a level that technical traders might consider a key resistance point. The advice to start selling at multiple levels such as $8, $9, and $10 is a risk management strategy to lock in profits gradually as the price approaches the target.
As for the second target, the analyst mentions that during the 2017-2018 bull run, XRP surged approximately 718% from its breakout point (around $0.35 – $0.39). By applying a similar 718% increase to a current local top of roughly $3.4, the analysis projects XRP could reach $27.
This method uses historical performance as a multiplier, proposing that if similar market dynamics repeat, XRP could see a comparable exponential move.
Reality Check: No Sure Thing
The analysis relies heavily on classic technical chart patterns and historical price behavior. These kinds of techniques are common among crypto traders who use patterns like triangle breakouts and historical multipliers to estimate potential price moves.
Still, past performance doesn’t guarantee future results, and it wouldn’t be the first time predictions missed the mark. All of this is still just speculation. External factors, regulatory developments, and shifts in market sentiment could alter these projections.
While this is based on technical and historical analyses, this kind of research should never be taken as an absolute truth.
Disclaimer: The information presented in this article is for informational and educational purposes only. The article does not constitute financial advice or advice of any kind. Coin Edition is not responsible for any losses incurred as a result of the utilization of content, products, or services mentioned. Readers are advised to exercise caution before taking any action related to the company.