Cryptos Headlines team is excited to share updates on the top AI tokens in the market with you. This information could be incredibly valuable for you, so be sure to give it a read as it may benefit you in the future.
The market research platform Layergg shared on X that the AI narrative was gaining attention. This followed a post by Ethereum (ETH) co-founder Vitalik Buterin, which Layergg referenced.
Narratives of the week :
– Vitalik wrote "Crypto + AI" post. Tokens mentioned in the article $TAO, $WLD. >Beneficiary AI $RNDR $AKT
– New coins are better than old coins : $MANTA $ALT $ONDO
– China's projects are newly joining the BTC Ecosystem. $CKB $CFX
– Restaking is… pic.twitter.com/lpd3P2Nyj3
— Layergg (@layerggofficial) January 30, 2024
AI and Crypto Integration: Potential Tokens to Watch
Buterin discussed the potential synergy between AI and cryptocurrency. This article highlights 10 AI tokens that traders should monitor closely for potential opportunities in the market.
1. Internet Computer (ICP) Analysis
Internet Computer operates at the intersection of cryptography and cloud computing, with some AI involvement. Over the past year, its token price surged by 102%.
However, the start of 2024 has been challenging for ICP. In the last 30 days alone, its value plummeted by 15.85%. Despite this, there could be a potential buying opportunity.
Analyzing the 4-hour chart, ICP’s price was noted at $11.39, with the 0.786 Fibonacci retracement suggesting a possible drop to $10.92. Should ICP decline to this level, it might present a favorable entry point before a potential recovery.
Moreover, signals from the MACD indicator indicated an impending downward momentum, given its negative reading.
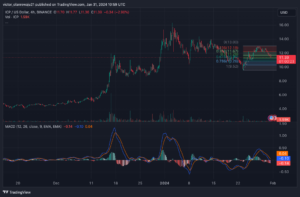
ICP/USD 4-Hour Chart (Source: TradingView)
In the short term, ICP may not experience a significant rally. However, its long-term outlook remains promising based on its underlying fundamentals.
2. Worldcoin (WLD) Analysis
Worldcoin, co-founded by OpenAI CEO Sam Altman, attracts attention as a project with notable potential. Despite facing controversy since its inception, it maintains prospects for long-term growth.
Over the past 30 days, WLD’s price experienced a significant decline of 34.03%. In the short term, the cryptocurrency may struggle to surpass $3, primarily due to resistance at $2.45. Additionally, the RSI indicates a reversal in bullish momentum.
However, the double-digit correction presents an opportunity for traders to purchase WLD at a discounted price. In an optimistic scenario, WLD could rally to $3.95. Nonetheless, there remains a possibility for the price to drop below $2.20.
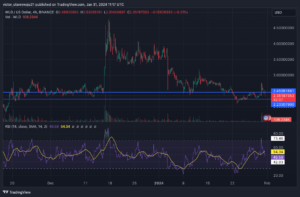
WLD/USD 4-Hour Chart (Source: TradingView)
3. Injective (INJ) Analysis
Injective, which recently reached $45, has since declined to $34.60. Analysis using Bollinger Bands (BB) indicates a decrease in volatility, suggesting that INJ may continue to trade within a narrow range.
However, this period of low volatility presents an opportunity for market participants to consider buying. If the bands expand, it could signal a breakout for INJ, potentially leading to a move toward $50.
Additionally, the Relative Strength Index (RSI) indicates that INJ is neither overbought nor oversold. This suggests that there is still room for bullish momentum to drive the price higher.
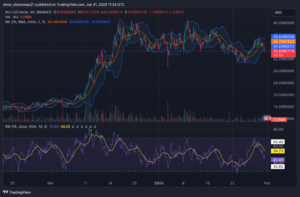
INJ/USD 4-Hour Chart (Source: TradingView)
4. Render (RNDR) Analysis
On the 4-hour timeframe, RNDR exhibited a bullish structure, with its price rising from $3.97 to $4.57 within a short period. However, the Relative Strength Index (RSI) indicated that the token became overbought when it reached $4.77, leading to a retracement.
Despite this, RNDR may retest the $4.77 resistance, supported by a level at $4.30. If it successfully breaks above this resistance, the price could potentially surge as high as $5.50. Alternatively, failing to move beyond this level may result in a decline to around $4.20.
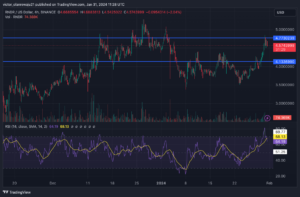
RNDR/USD 4-Hour Chart (Source: TradingView)
5. Akash Network (AKT) Analysis
Akash Network has demonstrated significant growth over the past year, with a remarkable increase of 756%. Additionally, its performance this year remains positive, with a 17.52% increase on a Year-To-Date (YTD) basis.
However, recent market activity suggests that investors may be capitalizing on profits from AKT. At the time of reporting, the Awesome Oscillator (AO) had turned negative, indicating a dominant presence of sellers in the market.
Furthermore, the Chaikin Money Flow (CMF) indicates a trend of liquidity exiting the Akash ecosystem. If this trend persists, it could lead to a potential drop in AKT’s price to around $2.50.
Despite these short-term challenges, AKT still holds potential for a strong performance, potentially repeating its impressive growth from the previous year.
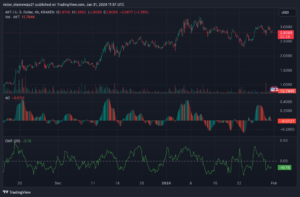
AKT/USD 4-Hour Chart (Source: TradingView)
6. The Graph (GRT) Analysis
The Graph (GRT) exhibits a structure similar to AKT, although its performance since the beginning of the year has been lackluster.
In the short term, GRT’s price may potentially decline below $0.15, as indicated by signals from the Exponential Moving Average (EMA). Presently, the 9 EMA (blue) has intersected with the 20 EMA (yellow), suggesting a possible sideways movement.
However, if GRT falls below $0.12, it could present a favorable entry point for long-term investors.
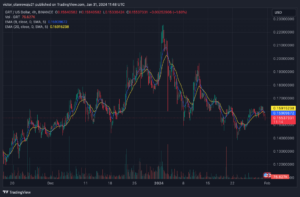
GRT/USD 4-Hour Chart (Source: TradingView)
7. Oasis Network (ROSE) Analysis
At the time of reporting, Oasis Network’s (ROSE) price stood at $0.10, with a short-term bullish trend observed. This trend was evidenced by the upward crossover of the 9 EMA (blue) over the 20 EMA (yellow). However, the price of the token dipped below the EMA, indicating the presence of sellers in the market.
If the crossover pattern persists and buyers enter the market, ROSE could potentially rise to $0.12 in the short term. Looking ahead, the burgeoning AI narrative surrounding Oasis Network could drive the price even higher in the long term.
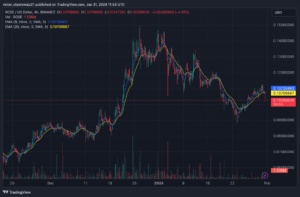
ROSE/USD 4-Hour Chart (Source: TradingView)
8. Fetch.ai (FET) Analysis
This year, Fetch.ai (FET) has experienced a decline in price by 20.94%. However, this drop appears to be a necessary correction following its impressive performance over the last 90 days.
Currently, selling pressure has pushed the support level down to $0.59, with FET trading at $0.57. There is a possibility that the price could further decrease to $0.55, which represents the next support zone.
If bulls fail to defend this support level, FET may drop to $0.49. However, this could potentially trigger a bullish reversal, leading to an upward movement in the price.
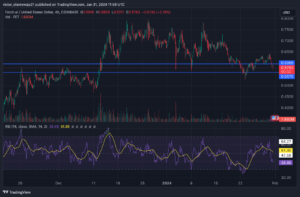
FET/USD 4-Hour Chart (Source: TradingView)
Currently, the Relative Strength Index (RSI) stands at 38.46, indicating a downtrend. If selling pressure increases, the RSI could potentially drop to 30.00. In such a scenario, traders should consider seeking entry points, as Fetch.ai (FET) may see significant upward movement from its current price.
9. SingularityNET (AGIX) Analysis
The On Balance Volume (OBV) on the 4-hour AGIX/USD chart indicates a period of stagnant buying activity, contributing to AGIX’s price range between $0.25 and $0.28.
Contrarily, signals from the Relative Strength Index (RSI) suggest a dominant presence of sellers, raising the possibility of a price decline for AGIX.
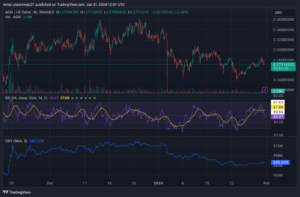
AGIX/USD 4-Hour Chart (Source: TradingView)
In a bearish scenario, the price could potentially drop to $0.24. However, if buying pressure surges, AGIX may experience a significant upward movement, potentially surpassing $0.35.
10. Bittensor (TAO) Analysis
Volatility surrounding TAO has been notably high recently, as indicated by the Bollinger Bands (BB). At the time of reporting, the price stood at $449.92, highlighting the prevailing bullish sentiment in the market.
Moreover, the Chaikin Money Flow (CMF) reading of $0.10 suggests significant buying pressure. If this pressure continues and pushes the CMF further into positive territory, TAO could potentially reach $460.
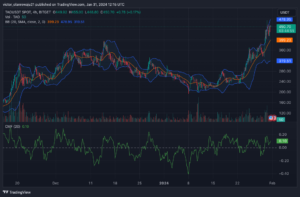
TAO/USDT 4-Hour Chart (Source: TradingView)
Additionally, the expanding bands of the BB indicate heightened price fluctuations, potentially allowing TAO to reach $500 in the near term.
Important: Please note that this article is only meant to provide information and should not be taken as legal, tax, investment, financial, or any other type of advice.
Join Cryptos Headlines Community
Follow Cryptos Headlines on Google News


