


The Ethereum price showed a modest drop of 0.3% during the U.S. Trading session on Wednesday, currently trading at $2432. This neutral candle formation projects indecisive market sentiment with no clear dominance of buyers or sellers. While the ETH price consolidation trend continues, these 5 reasons could drive Ether into a more directional trend.
Ethereum’s MVRV Ratios Hint at Potential Long-Term Recovery
According to Santiment data, the 365-day Market Value to Realized Value (MVRV) stabilizes around -13.7%. The ratio provides valuable insights into the profitability of Ethereum holders over the past year, aka long-term holders.
Historically, a deep negative value has coincided with major market bottoms, as observed in June 2022 and October 2023. Thus, The ethereum price could prepare for a major recovery trend in the mid to long-term period.

In addition, the on-chain data shows a recent rebound in the 30-day MVRV ratio, an indicator that tracks the profitability of short-term holders over the past 30 days compared to its market price.
After hitting a low -21% in August, the MRVR ratio has notably surged to -1.35%, suggesting that short-term holders are beginning to recover and could fuel renewed buying interest in the market.

Analyst Warns of Ethereum Drop to $2350
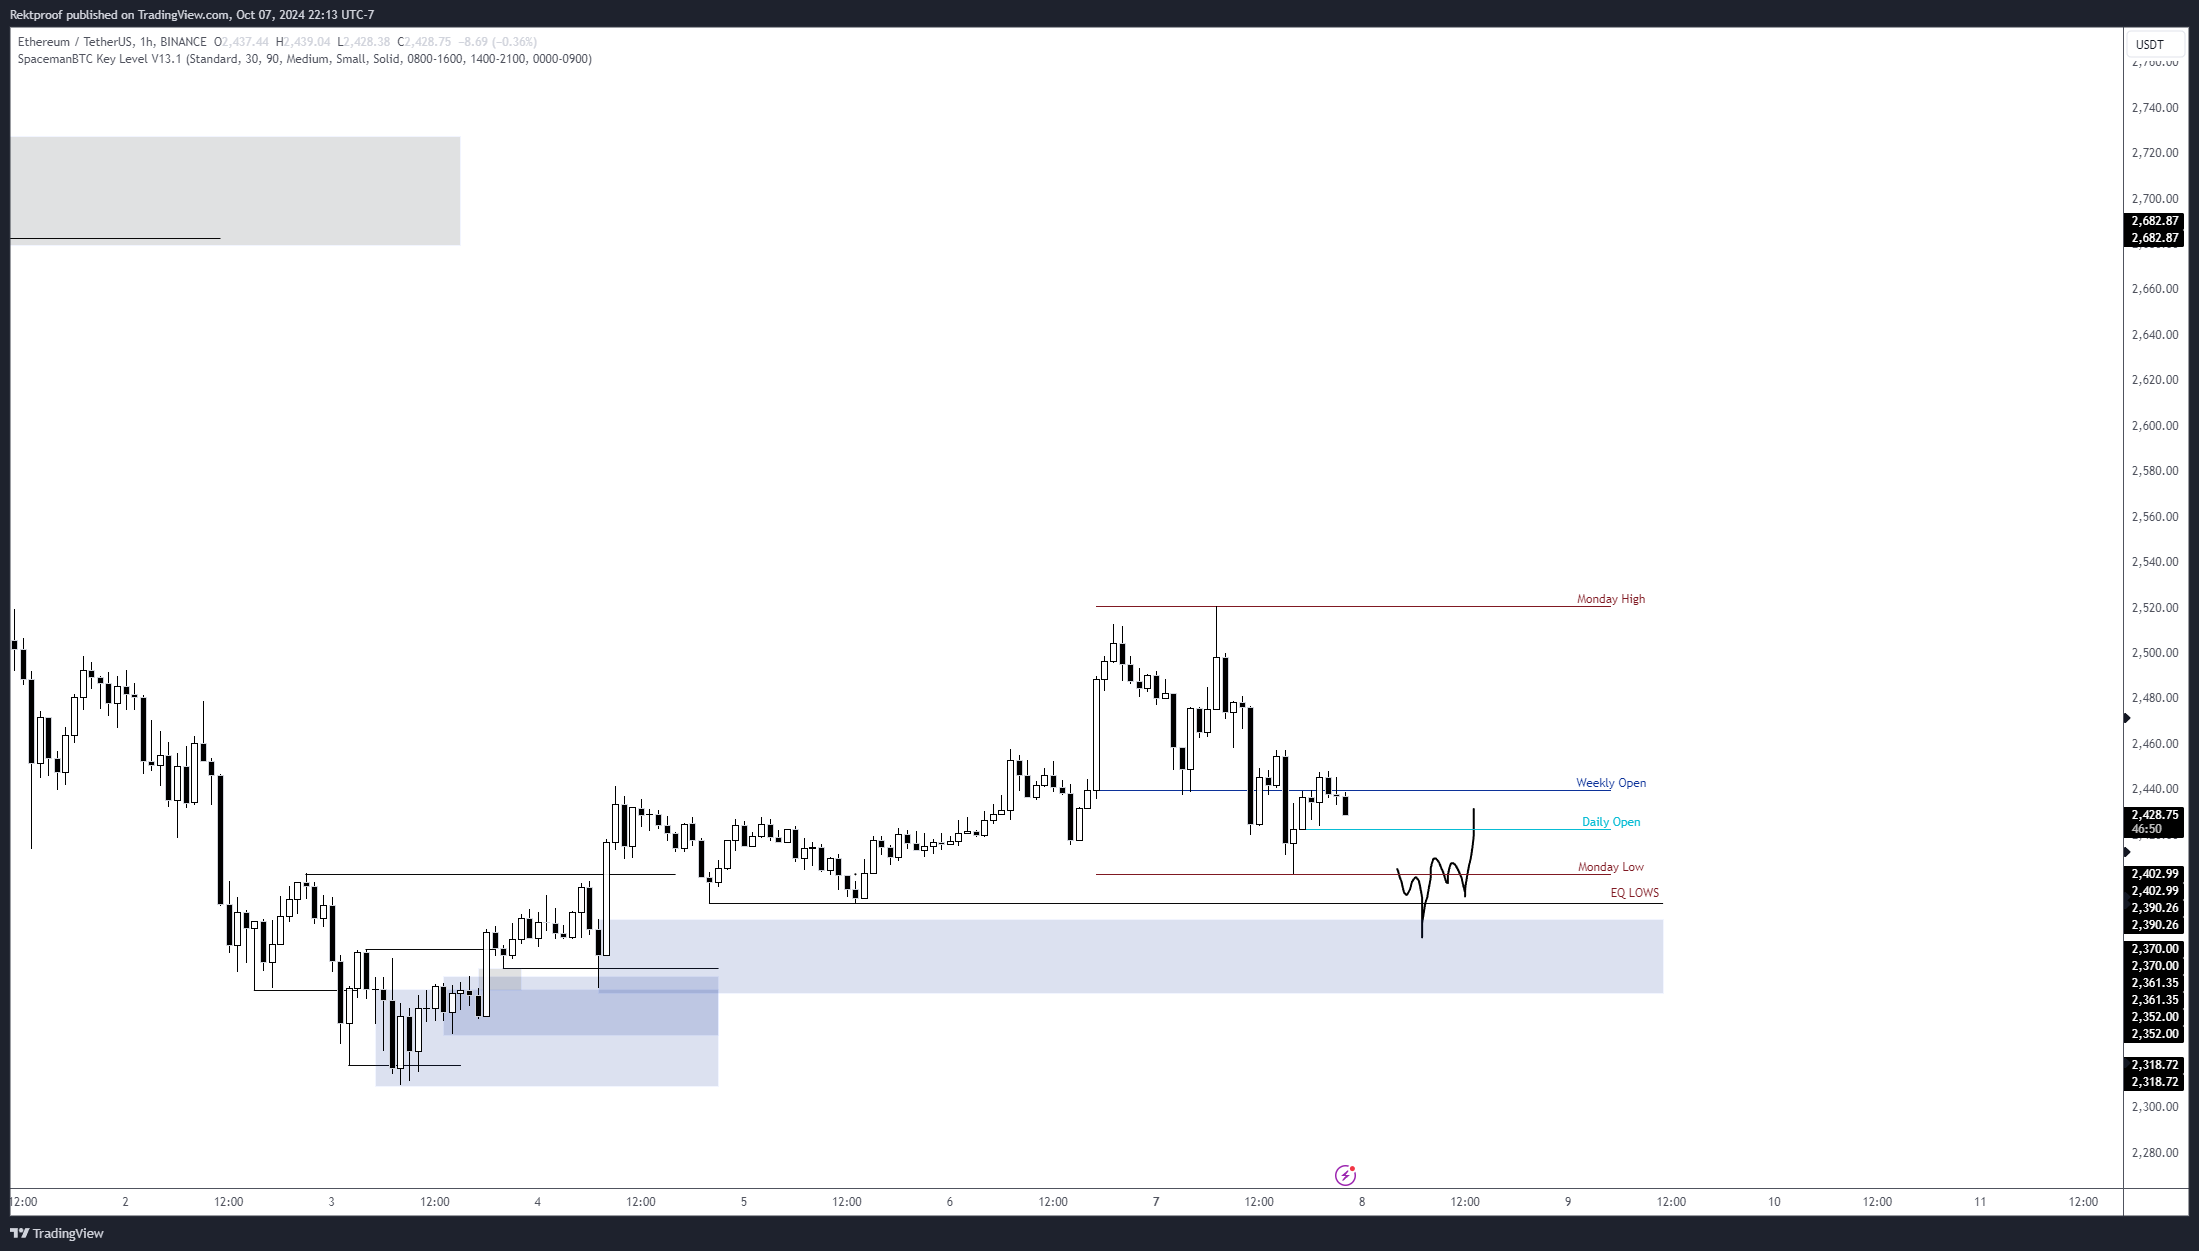
Since last week, the ETH price has shown a notable bounce from $2300 to $2460, accounting for a 6% surge. However, the overhead supply has rejected the price sharply and plunged below the $2460 weekly open, as shown in Rektproof’s chart analysis.
If the BTC price shows a lack of bullish momentum, the Ethereum price could plunge to $2350 and retest the accumulation zone of the hourly chart. The support could recuperate the bullish momentum for a sustained reversal.
Declining Active Addresses and Rising ETH Supply Suggest Bearish Outlook
Since the onset of October, the 24-hour active addresses in the ETH network have declined from 512.8k to $434.2K— a 15% drop. This decrease in active addresses suggests a reduction in the number of participants engaging with the Ethereum network daily. Such a decline may indicate waning interest and support a short-term bearish outlook for Ether.

Furthermore, the ETH supply has steadily risen since July 2024, coinciding with the extended price correction below $3000. An increasing trend in this indicator is that investors have been moving their assets into exchange, increasing selling potential.
Moreover, whale transactions (involving more than 100k ETH) have remained consistently low, staying under 1000 since mid-August. This sluggish activity among large holders during the recent price rebound suggests that the recovery did not capture much attention from these key market participants.

Ethereum Foundation Wallet Moves 2,500 ETH to Bitstamp
In a recent on-chain transaction, a wallet linked to the Ethereum Foundation transferred 1,200 ETH (worth approximately $3.03 million) to the Bitstamp exchange. According to Lookonchain, this wallet received 51,251 ETH from the Ethereum Foundation on November 17, 2015, valued at $51.2K back then and worth $124.5 million at current prices.
These large transactions, especially from foundation-linked wallets, often create market uncertainty or trigger temporary volatility in the market.
A wallet related to the #EthereumFoundation deposited 1,250 $ETH($3.03M) to #Bitstamp 20 mins ago.
On Nov 17, 2015, the wallet received 51,251 $ETH($51.2K at that time, $124.5M currently) from the #EthereumFoundation.https://t.co/RV8HZrxgKH pic.twitter.com/uHQJH2Itp7
— Lookonchain (@lookonchain) October 8, 2024
Symmetrical Triangle Pattern Hints Potential Move
In the last two months’ consolidation, the Ethereum price prediction daily chart shows a symmetrical triangle formation. Theoretically, the chart pattern drives a temporary consolidation within two converging trendlines before a directional rally.
If the anticipated drop in ETH price breaks below the lower support trendline, the accelerated selling pressure could drive a fall from $2200 to $2000.

On the contrary note, the triangle pattern breakout around $2600 could replenish the bullish momentum for a rally above $3000 psychological resistance.
Frequently Asked Questions (FAQs)
Ethereum’s 365-day MVRV ratio suggests a potential recovery for long-term holders, while analysts warn of a possible drop to $2350. Meanwhile, declining active addresses and whale inactivity hint at a bearish trend
Analysts warn that Ethereum could drop to $2350 if the BTC price shows a lack of bullish momentum.
The decline in active Ethereum addresses, coupled with a rising ETH supply since July 2024, indicates a bearish outlook
Sahil Mahadik
Sahil is a dedicated full-time trader with over three years of experience in the financial markets. Armed with a strong grasp of technical analysis, he keeps a vigilant eye on the daily price movements of top assets and indices. Drawn by his fascination with financial instruments, Sahil enthusiastically embraced the emerging realm of cryptocurrency, where he continues to explore opportunities driven by his passion for trading
Disclaimer: The presented content may include the personal opinion of the author and is subject to market condition. Do your market research before investing in cryptocurrencies. The author or the publication does not hold any responsibility for your personal financial loss.


✓ Share: