

- QNT is consolidating within a descending wedge, with technical indicators signaling potential upward movement.
- Despite bullish sentiment, rising exchange reserves could introduce selling pressure and limit upside.
Quant [QNT] has been stuck in a descending wedge pattern since mid-March, with its price constrained between $60 and $70 for months. However, recent consolidation near $64.2 signals that a breakout may be imminent.
Both crowd and smart money sentiment are turning bullish, raising the question: Can QNT break out of its downtrend and surge toward higher resistance levels?
QNT’s descending wedge: Is a reversal on the horizon?
The descending wedge is a common bullish reversal pattern, and with QNT consolidating around $63.6 at press time, the market is closely watching for a potential breakout.
A breakout above the key resistance levels around $70 could open the door to a rally toward $120.
However, this will depend on whether Quant can gather enough buying pressure to break free from the wedge and push higher. Additionally, the narrowing range indicates a tightening price action, which historically precedes significant moves.
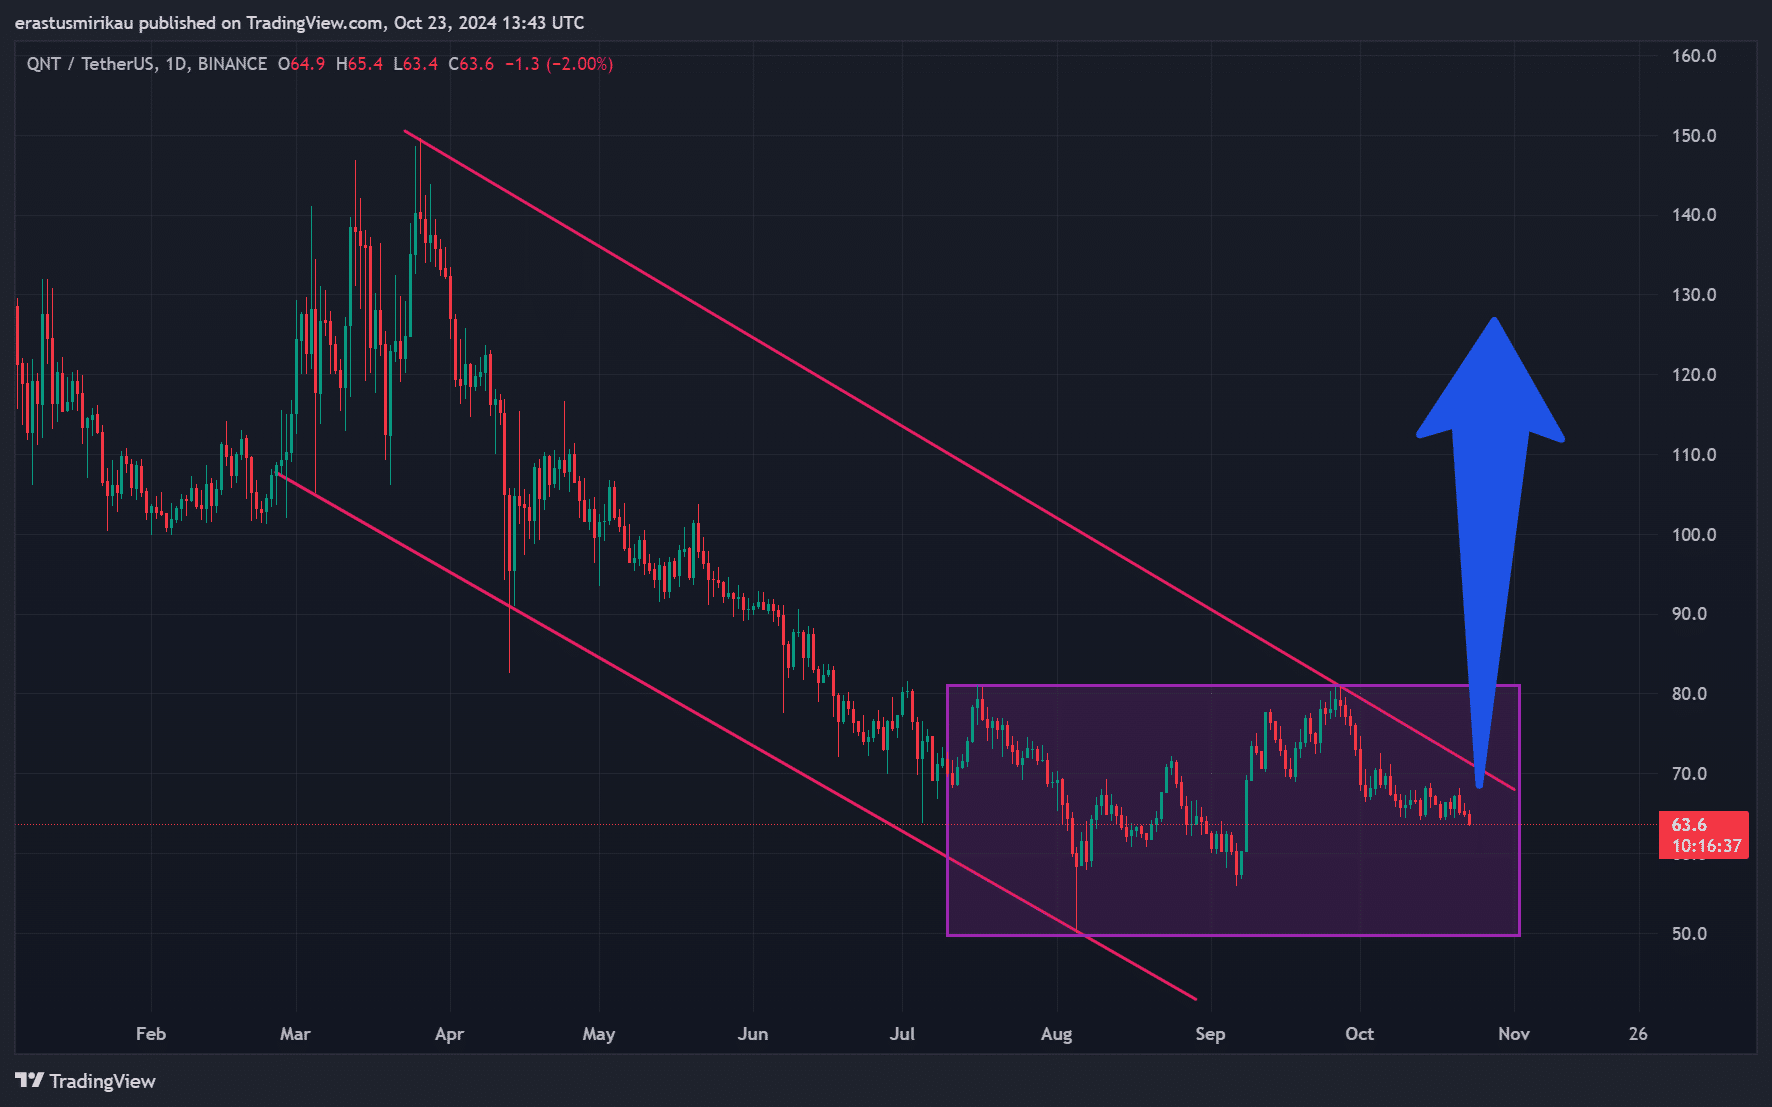
Source: TradingView
Bollinger Bands and RSI: Is momentum building?
The technical indicators offer further insight into Quant’s situation. The Bollinger Bands are tightening, showing reduced volatility, while the Relative Strength Index (RSI) sits at 42.67, just above oversold territory.
Consequently, the RSI suggests that there is still room for a potential upward movement. Historically, when these two indicators align, a breakout often follows. However, traders must be cautious, as false breakouts can occur without sufficient volume and momentum.
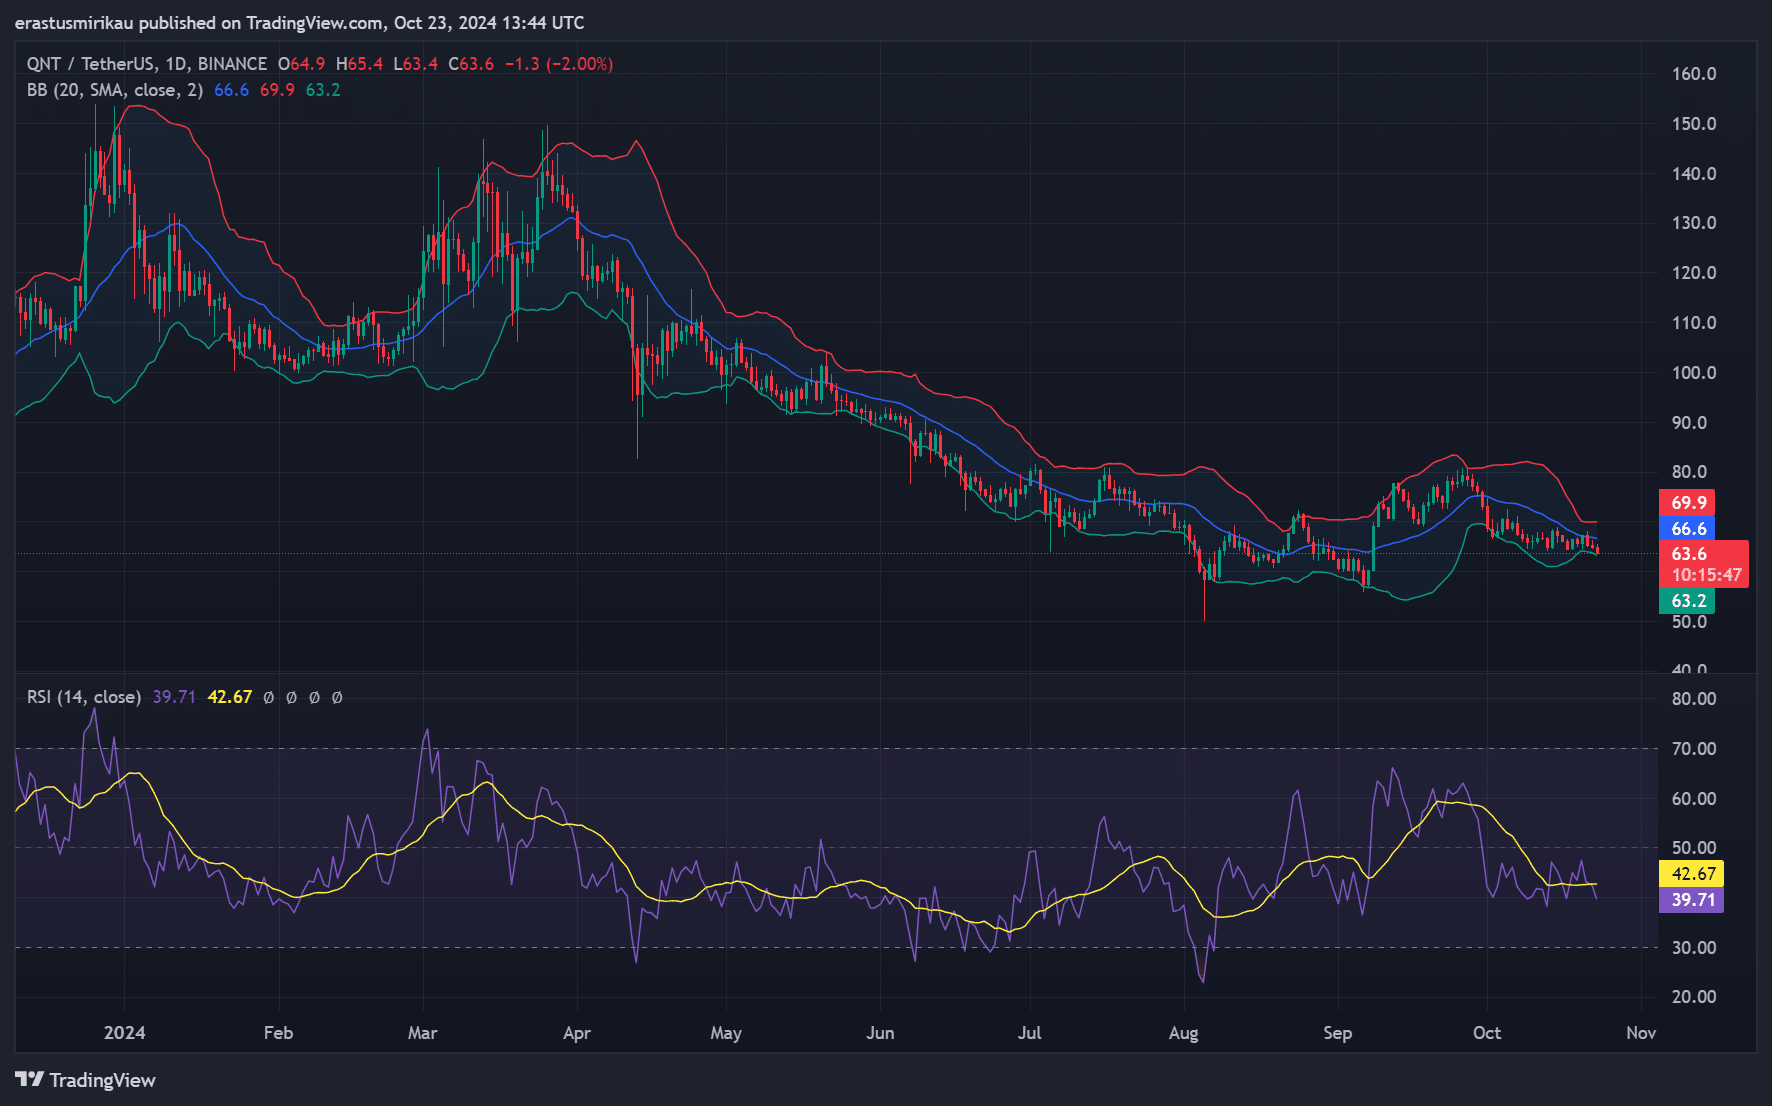
Source: TradingView
Exchange reserves: Is selling pressure increasing?
On-chain data reveals a slight uptick in exchange reserves, rising by 0.22% to 1.5487 million Quant in the last 24 hours. An increase in exchange reserves often signals growing selling pressure, as more tokens are being moved to exchanges.
Therefore, this could limit the potential upside in the short term if selling intensifies. Additionally, QNT needs to overcome this selling pressure to maintain its bullish trajectory.
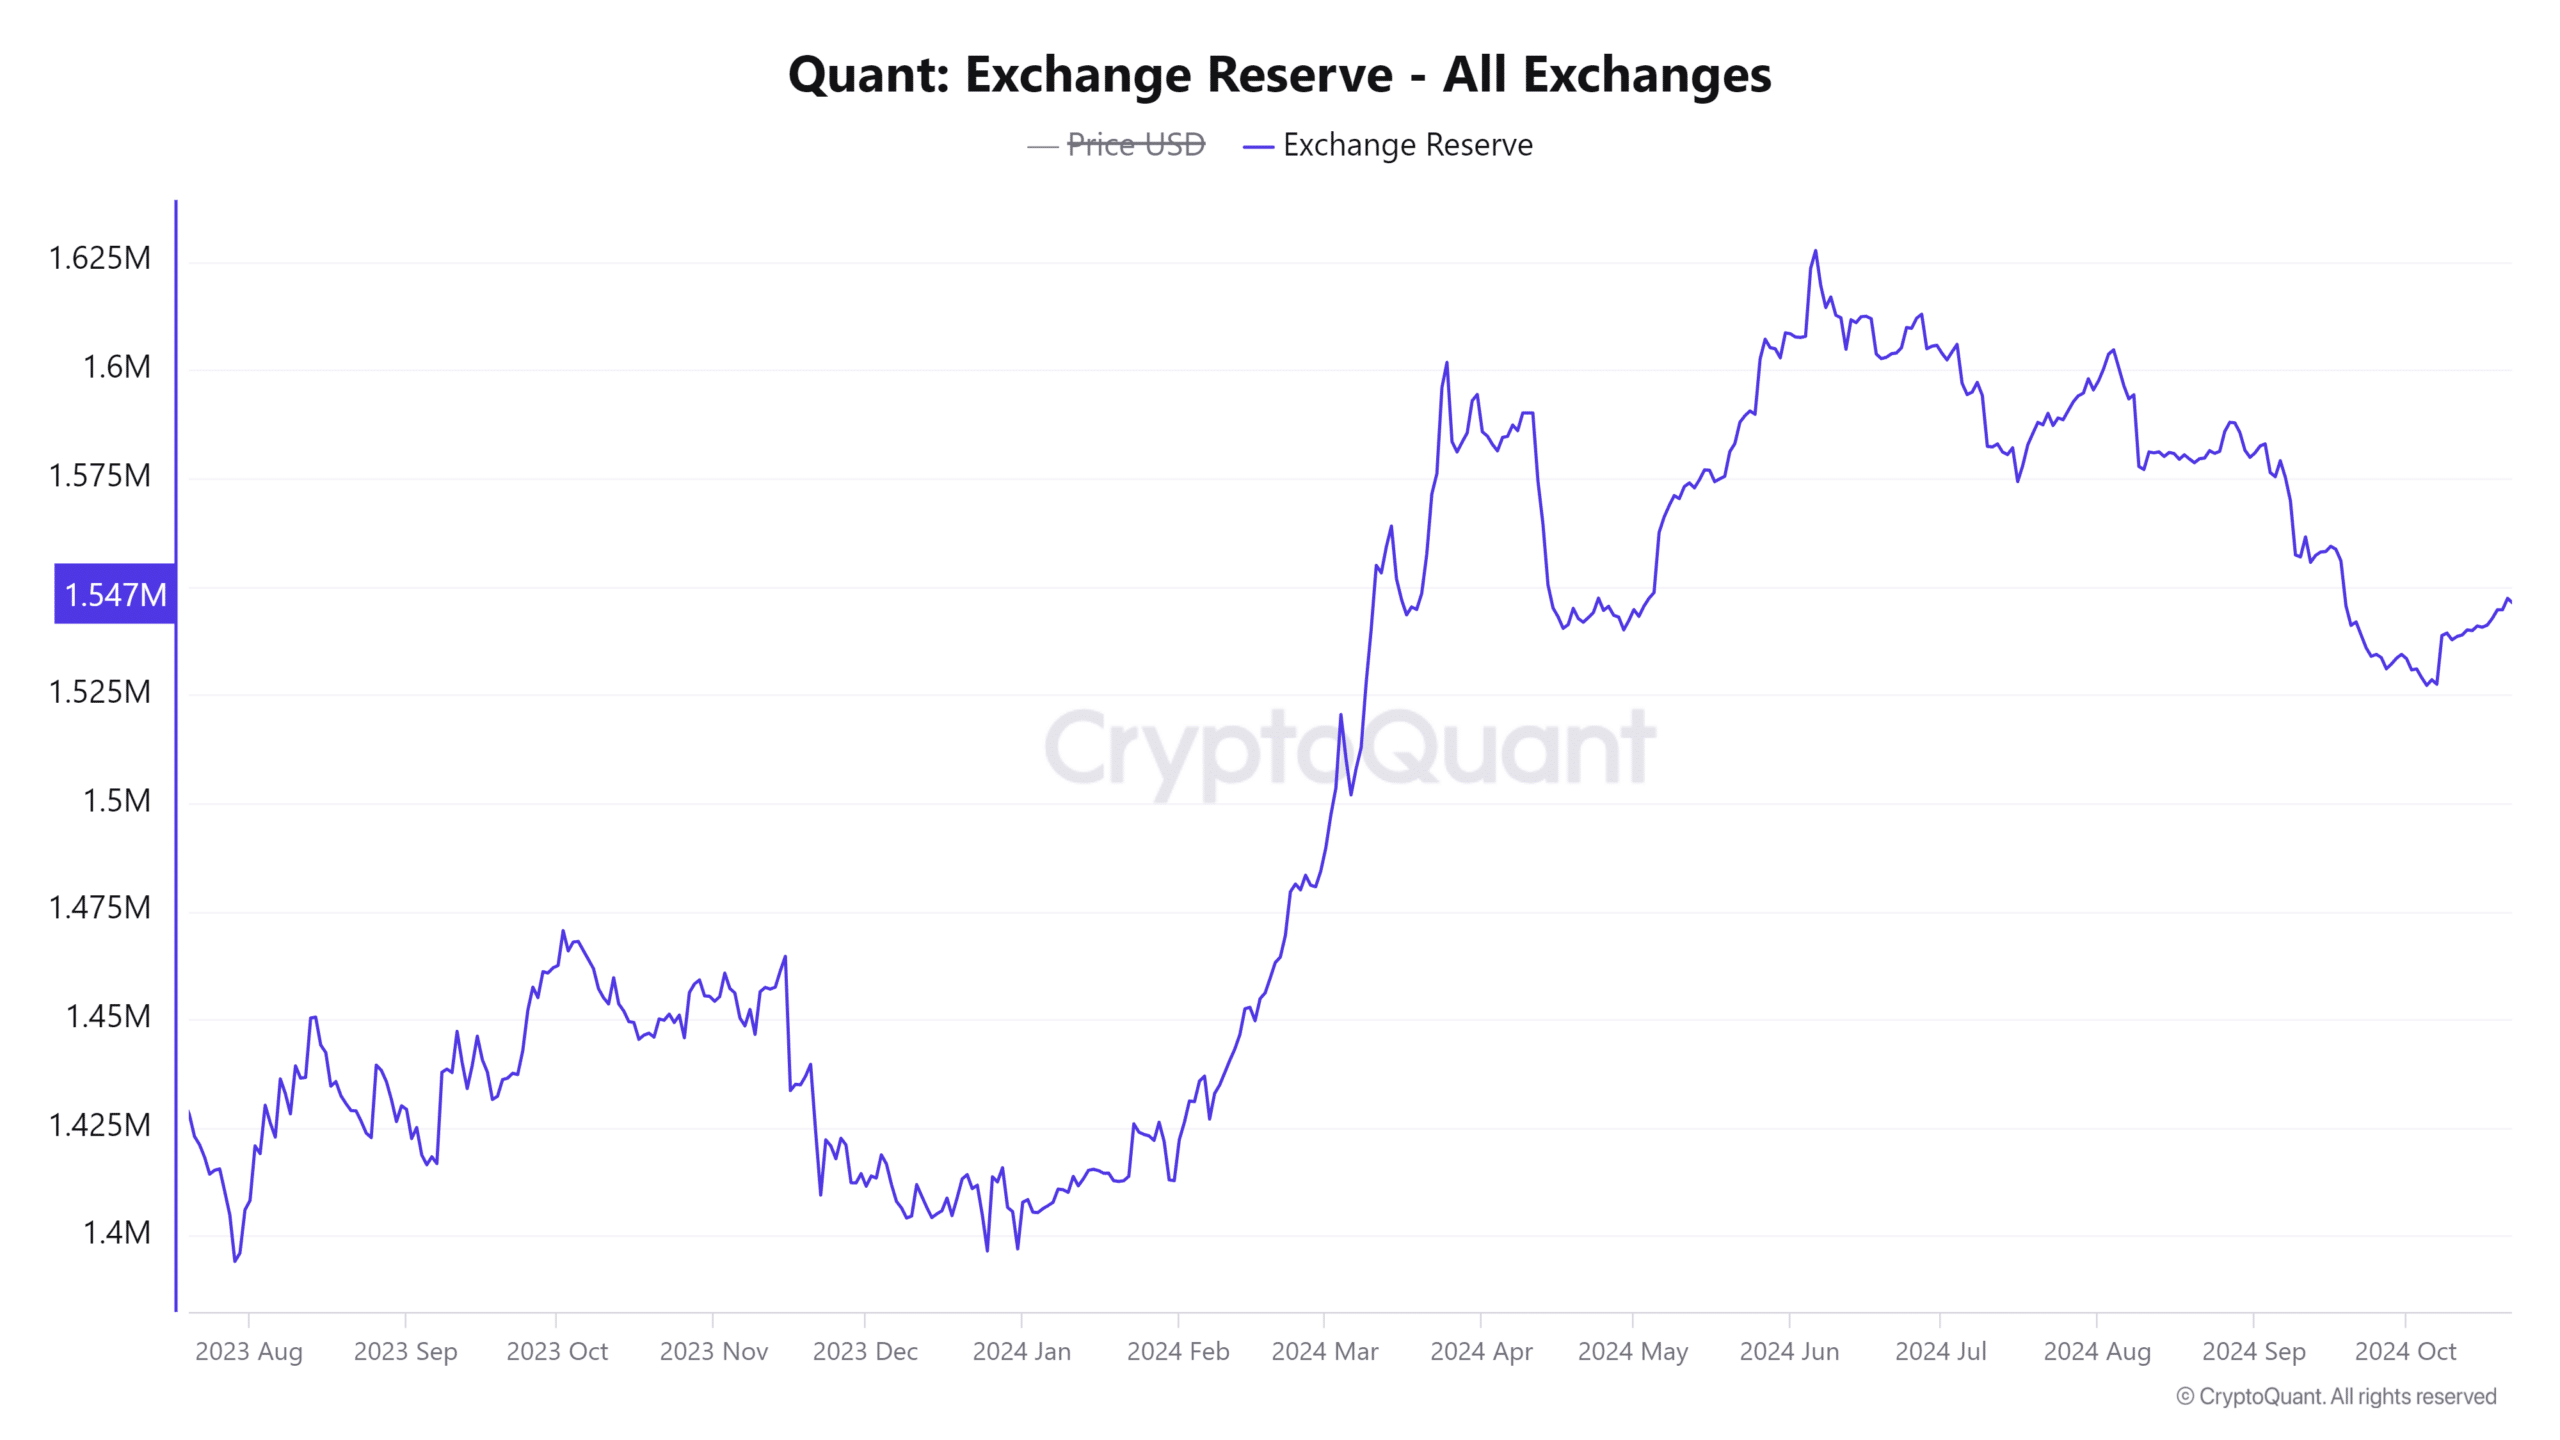
Source: CryptoQuant
Liquidations: Market stability or risk?
Liquidation data shows that there has been minimal long liquidation activity, with only $2.91K worth of longs liquidated. Consequently, the market remains relatively stable, with low leverage, which reduces the risk of forced selling.
However, should QNT experience a sharp price move, liquidations could rise quickly, potentially amplifying volatility.
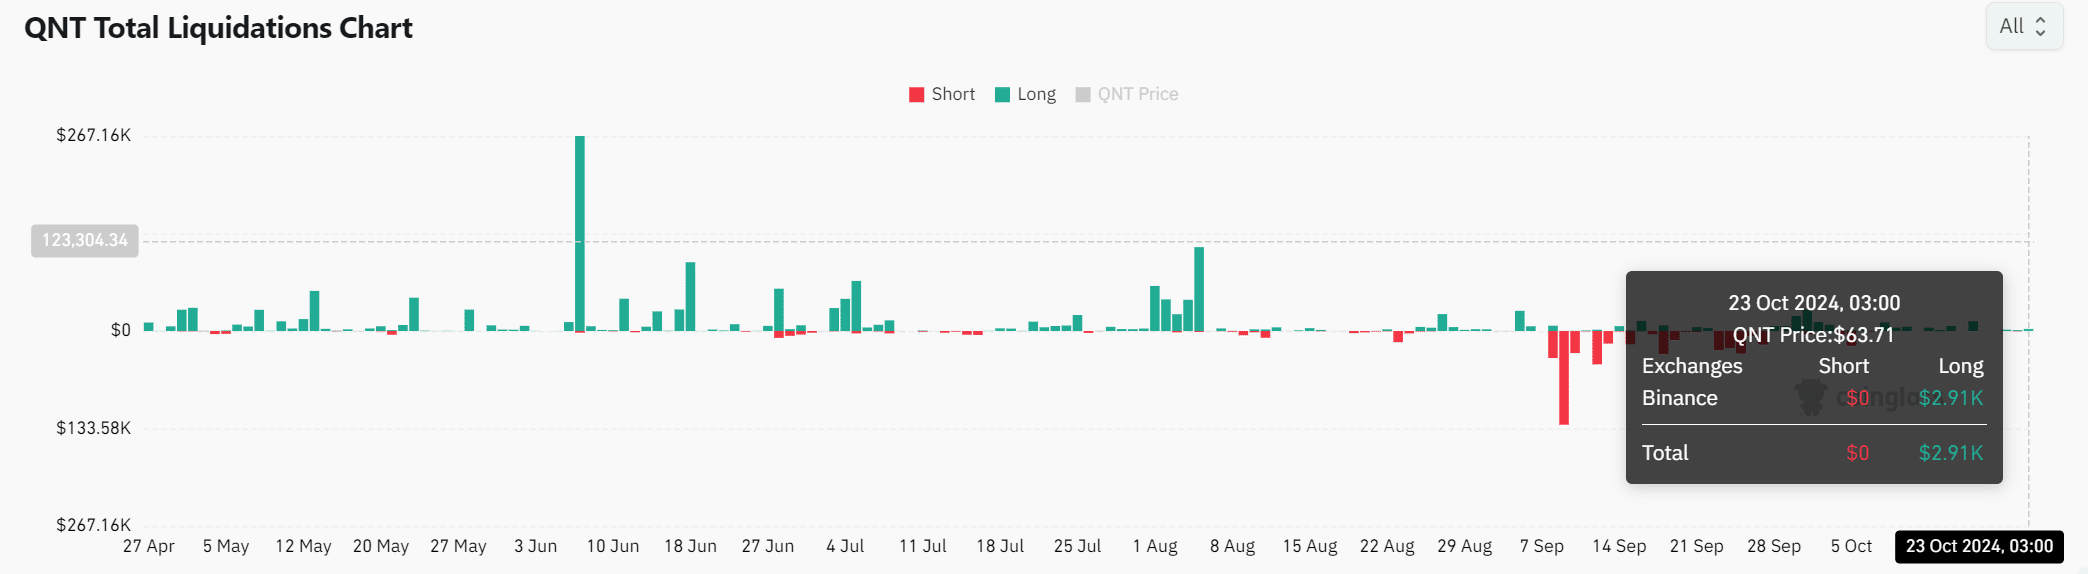
Source: Coinglass
Read Quant’s [QNT] Price Prediction 2024–2025
Will QNT break out?
With sentiment turning bullish and technical indicators suggesting a possible breakout, QNT appears to be positioned for a potential upward move.
However, rising exchange reserves indicate that sellers could weigh on any price surge. If QNT can clear resistance levels and maintain its momentum, it could test higher levels, possibly reaching $120.