- XRP’s price is testing key resistance at $0.529, a critical level that could pave the way for a bullish breakout if surpassed.
- Rising Open Interest for XRP indicates heightened market engagement, signaling a potential increase in price volatility.
As Ripple XRP’s price hovers around the $0.51 mark, market watchers are closely monitoring whether the asset can break above crucial resistance levels in the coming week.
A look at the Open Interest (OI) metric, alongside other technical indicators, suggests an interesting mix of forces at play.
Ripple’s key resistance levels and potential breakout
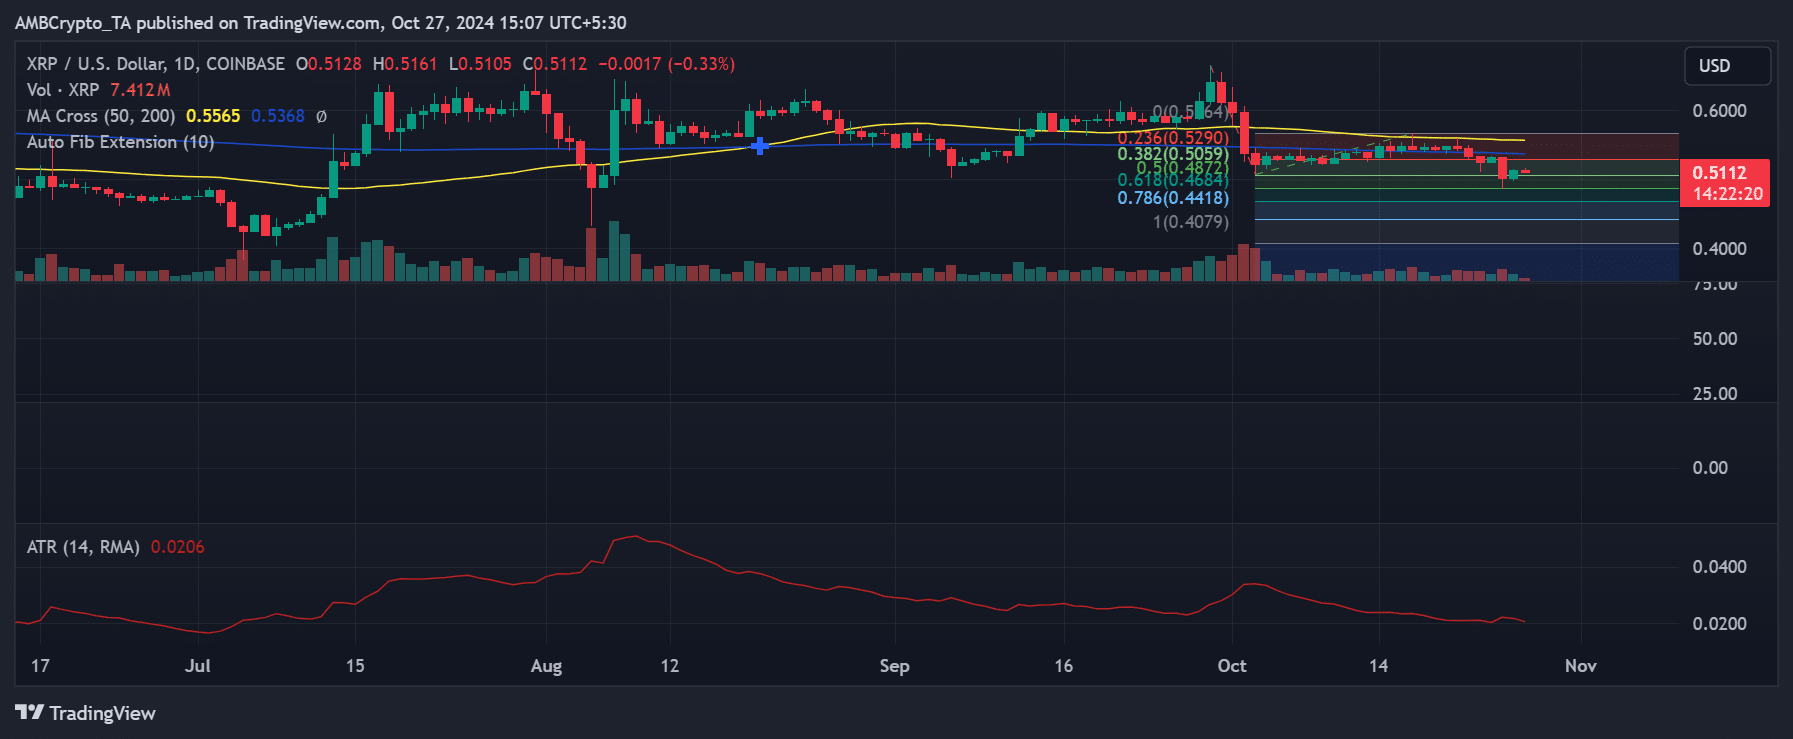
A recent analysis of Ripple’s daily chart reveals several important price zones. The Auto Fibonacci Extension tool places resistance at $0.529, a level XRP has tested previously but failed to sustain above.
This level marks the 23.6% Fib retracement from XRP’s prior highs, making it a critical area to watch.
If XRP can build enough momentum to break above this level, the next hurdle lies around $0.564, aligning with the 50-day Moving Average (MA) and prior support-turned-resistance.
A successful breach here could pave the way for further upside, potentially pushing XRP into a bullish phase.
However, downside risk remains if XRP fails to generate sufficient buying pressure. The support levels to watch are the 38.2% and 50% Fib retracement levels, sitting at approximately $0.505 and $0.482, respectively. A dip below these zones could indicate renewed bearish sentiment, potentially signaling more extended consolidation.
Rising Open Interest indicates growing market engagement
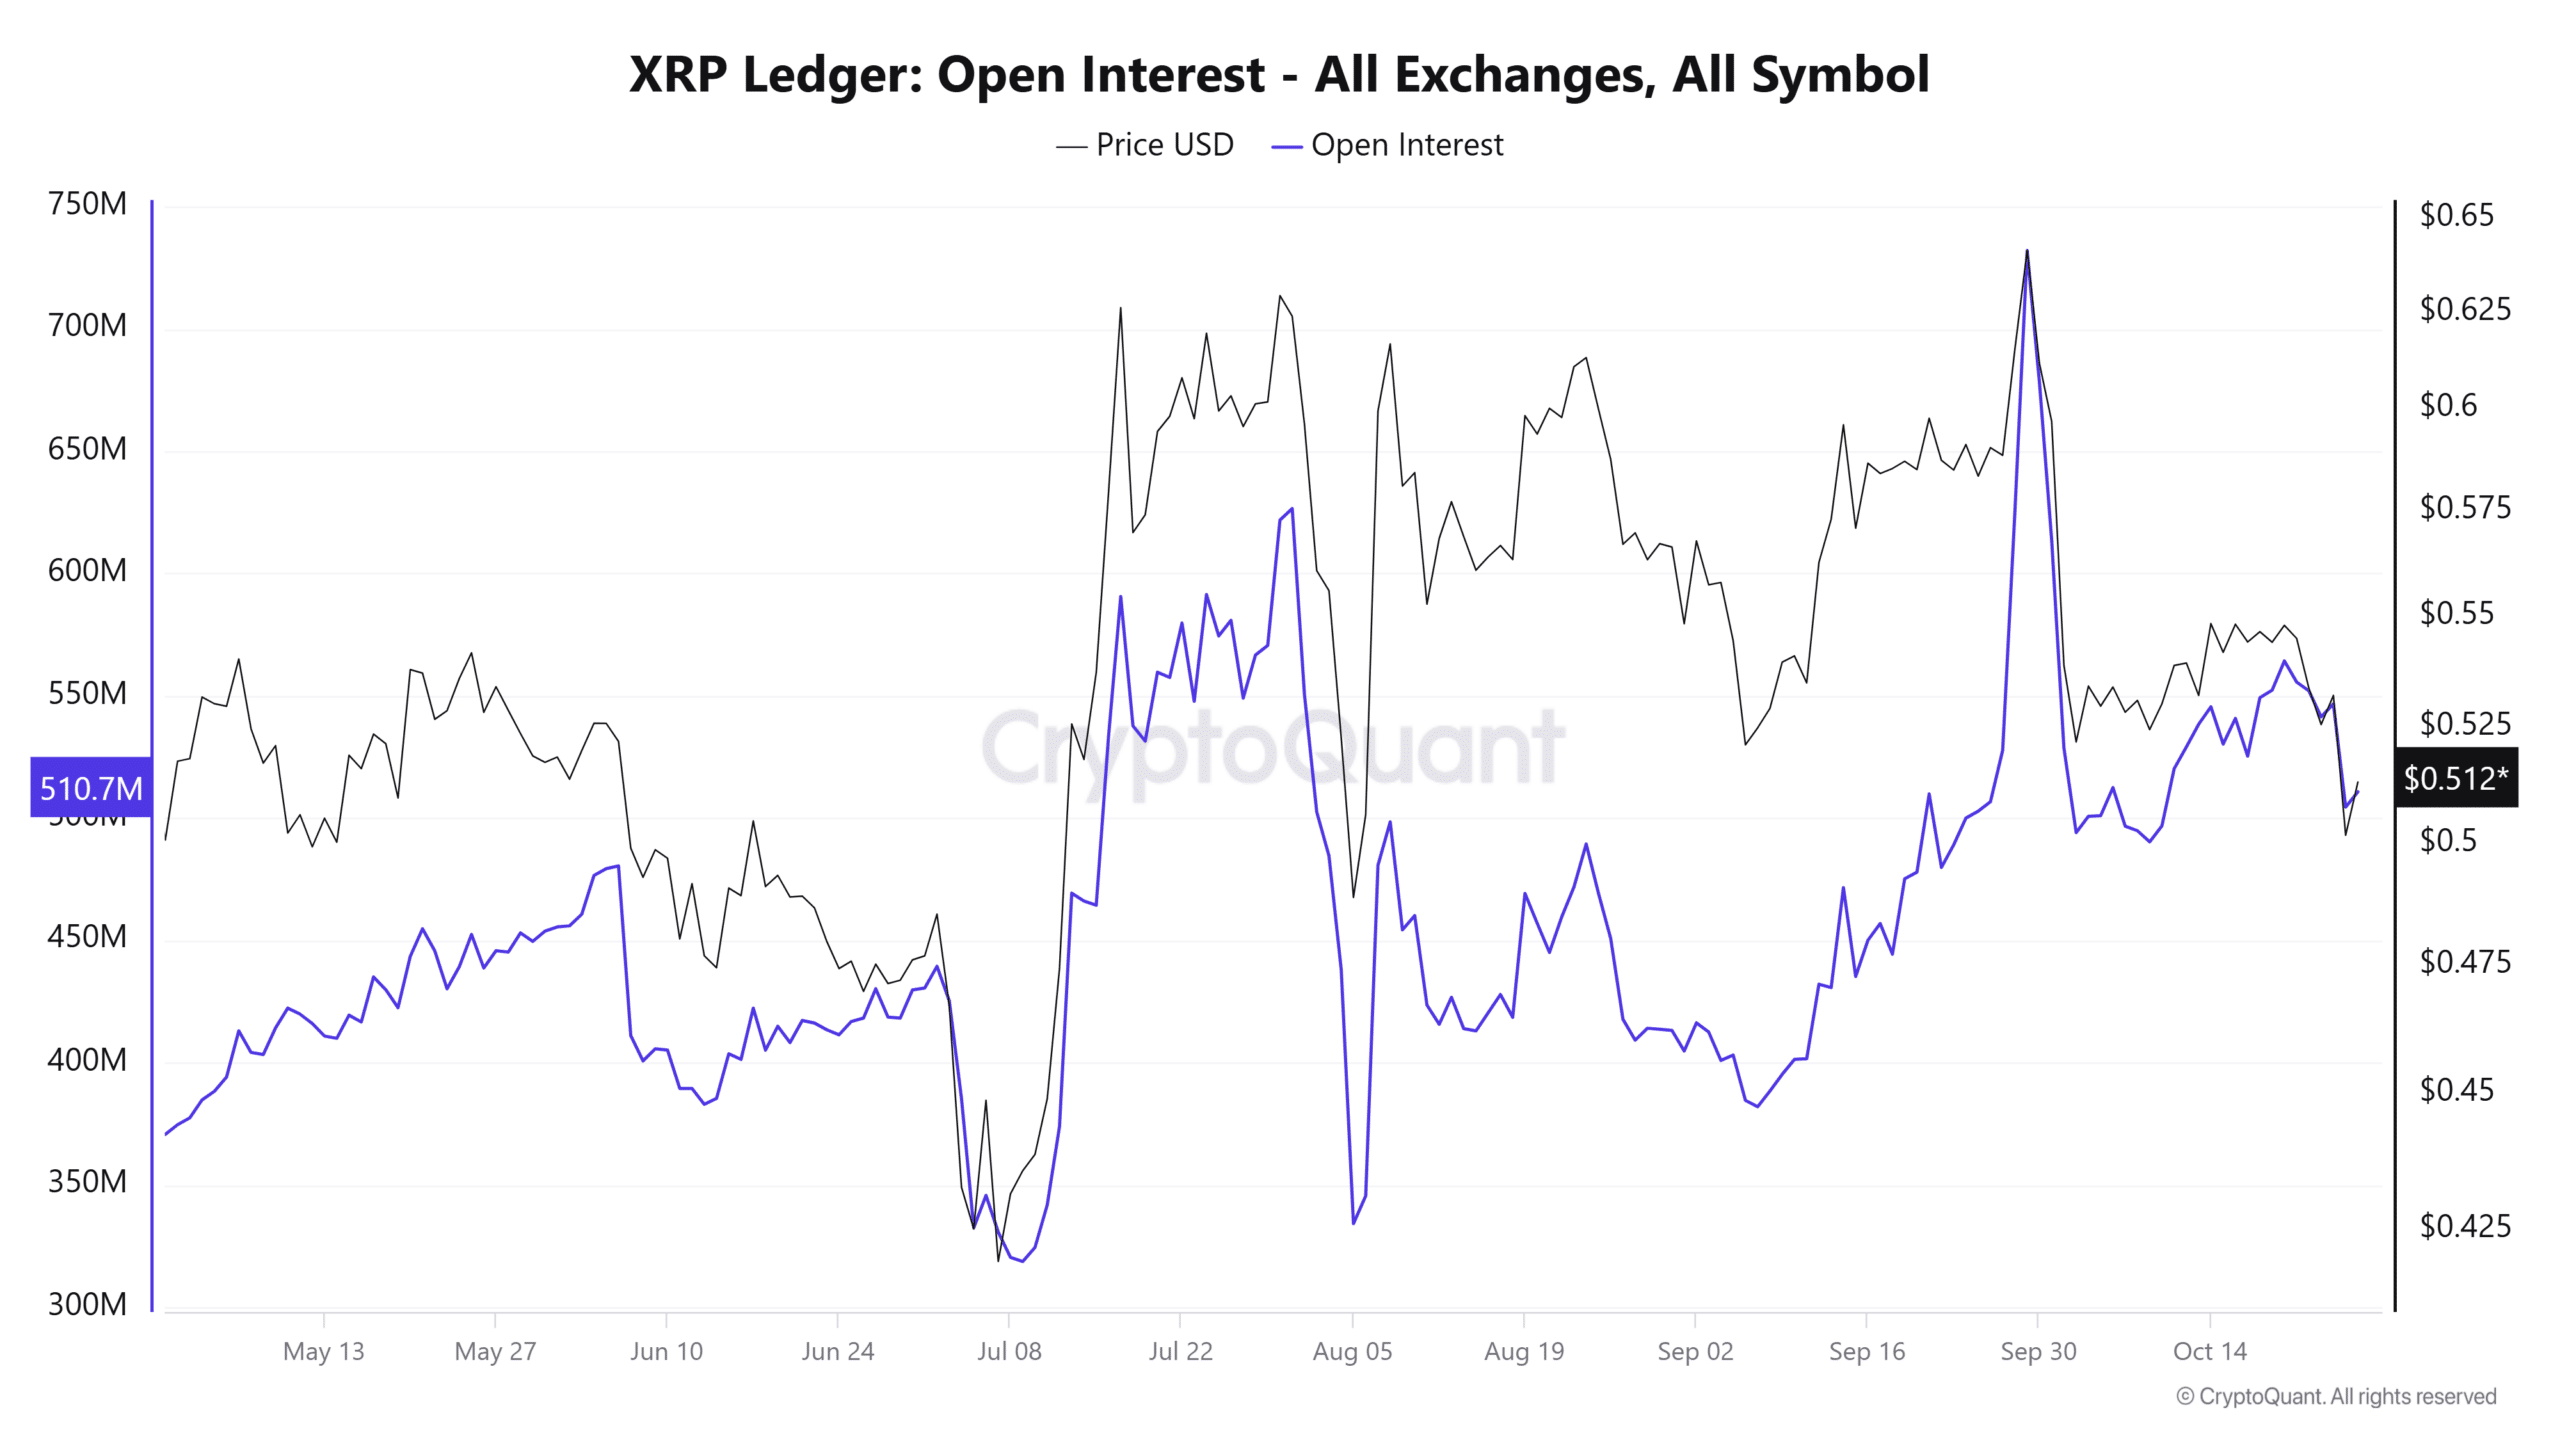
Analysis of the Open Interest (OI) metric for Ripple across all exchanges shows a steady increase. The slight increase suggests heightened engagement from both bulls and bears.
As of recent data, OI sits around 510.7 million, a level that has previously corresponded with significant price moves. Rising OI generally signals increased capital flowing into the market as traders place new positions anticipating a major price shift.
Historically, XRP’s price tends to experience heightened volatility when OI reaches elevated levels. It often indicates that a breakout or breakdown is imminent.
If OI continues to climb in the coming days, it may serve as a precursor to a more pronounced price move. This increased market activity could either catalyze a bullish breakout above resistance or fuel a downward correction if sell pressure outweighs buying interest.
Will Ripple’s ATR and RSI indicators signal a trend shift?
From a volatility perspective, Ripple’s Average True Range (ATR) indicator shows relatively low volatility. The trend suggests a potential squeeze that often precedes significant price movement.
The ATR on the daily timeframe has held steady, hinting at a tightening price range that could soon give way to a more decisive trend.
Is your portfolio green? Check out the Ripple Profit Calculator
Additionally, its Relative Strength Index (RSI) remains just below the 50 level, implying that the asset is neither in overbought nor oversold territory.
Should the RSI start climbing toward 60 or higher, it would signal increasing buying momentum, potentially reinforcing a bullish breakout. Conversely, a drop below 40 on the RSI could indicate mounting selling pressure, leading to a potential retest of lower support levels.


