


According to Lookonchain, a whale bought 423,443 LINK at $7.67 per coin. The last time this whale bought LINK, its price went up by 6%. On LINK’s daily chart, there’s a pattern called a symmetrical triangle, which hints at a potential upcoming price breakout.

In a recent post on X (formerly Twitter), the on-chain tracking platform Lookonchain shared that a whale bought 424,443 Chainlink (LINK) in the last few hours. The purchase cost the whale $3.25 million, with each LINK coin priced at $7.67.
This whale spent $3.25M to buy 424,443 $LINK again at a price of $7.67 an hour ago.
Which caused the price of $LINK to increase again.https://t.co/pRCcK2tQAa pic.twitter.com/VHe2CTrBTi
— Lookonchain (@lookonchain) October 8, 2023
This isn’t the first time this whale has bought a large amount of LINK recently. Back on July 20, 2023, Lookonchain shared in an X post that the same whale purchased 788,877 LINK, valued at around $6 million.
2 whales (probably the same person) bought a total of 788,877 $LINK ($6 million) for $7.62 just now.
The whale swapped all 3,074 $stETH ($5.87M) and 71 $ETH ($136K) for 788,877 $LINK.
This purchase increased the price of $LINK by 6.5%. pic.twitter.com/ajLBP8Vesz
— Lookonchain (@lookonchain) July 20, 2023
After the previous purchase, the price of LINK went up by 6.5%. So, Lookonchain is wondering if this new purchase by the same whale might also have a similar impact on LINK’s price in the near future.
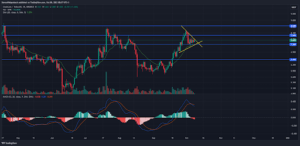
Daily chart for LINK/USDT (Source: TradingView)
Symmetrical Triangle Pattern
On LINK’s daily chart, there’s been a symmetrical triangle pattern forming over the past week. This pattern suggests that LINK’s price might break out in the coming days.
If the breakout goes upward, LINK could aim for the next resistance at $7.940 within a week. If bulls keep pushing, LINK may turn this level into support and target the next barrier at $8.60 in the following days.
However, if the breakout goes downward, LINK could drop below the immediate support at $7.365, which also aligns with the 20-day EMA line. If this happens, LINK’s price might fall as low as $6.485.
The daily MACD line recently crossed below the daily MACD Signal line after LINK fell below the $7.940 mark on October 2, 2023. This suggests a possible continuation of a negative short-term trend. If this bearish trend continues, LINK could head towards the $6.485 support level.
Important: Please note that this article is only meant to provide information and should not be taken as legal, tax, investment, financial, or any other type of advice.
Join Cryptos Headlines Community
Follow Cryptos Headlines on Google News
Author