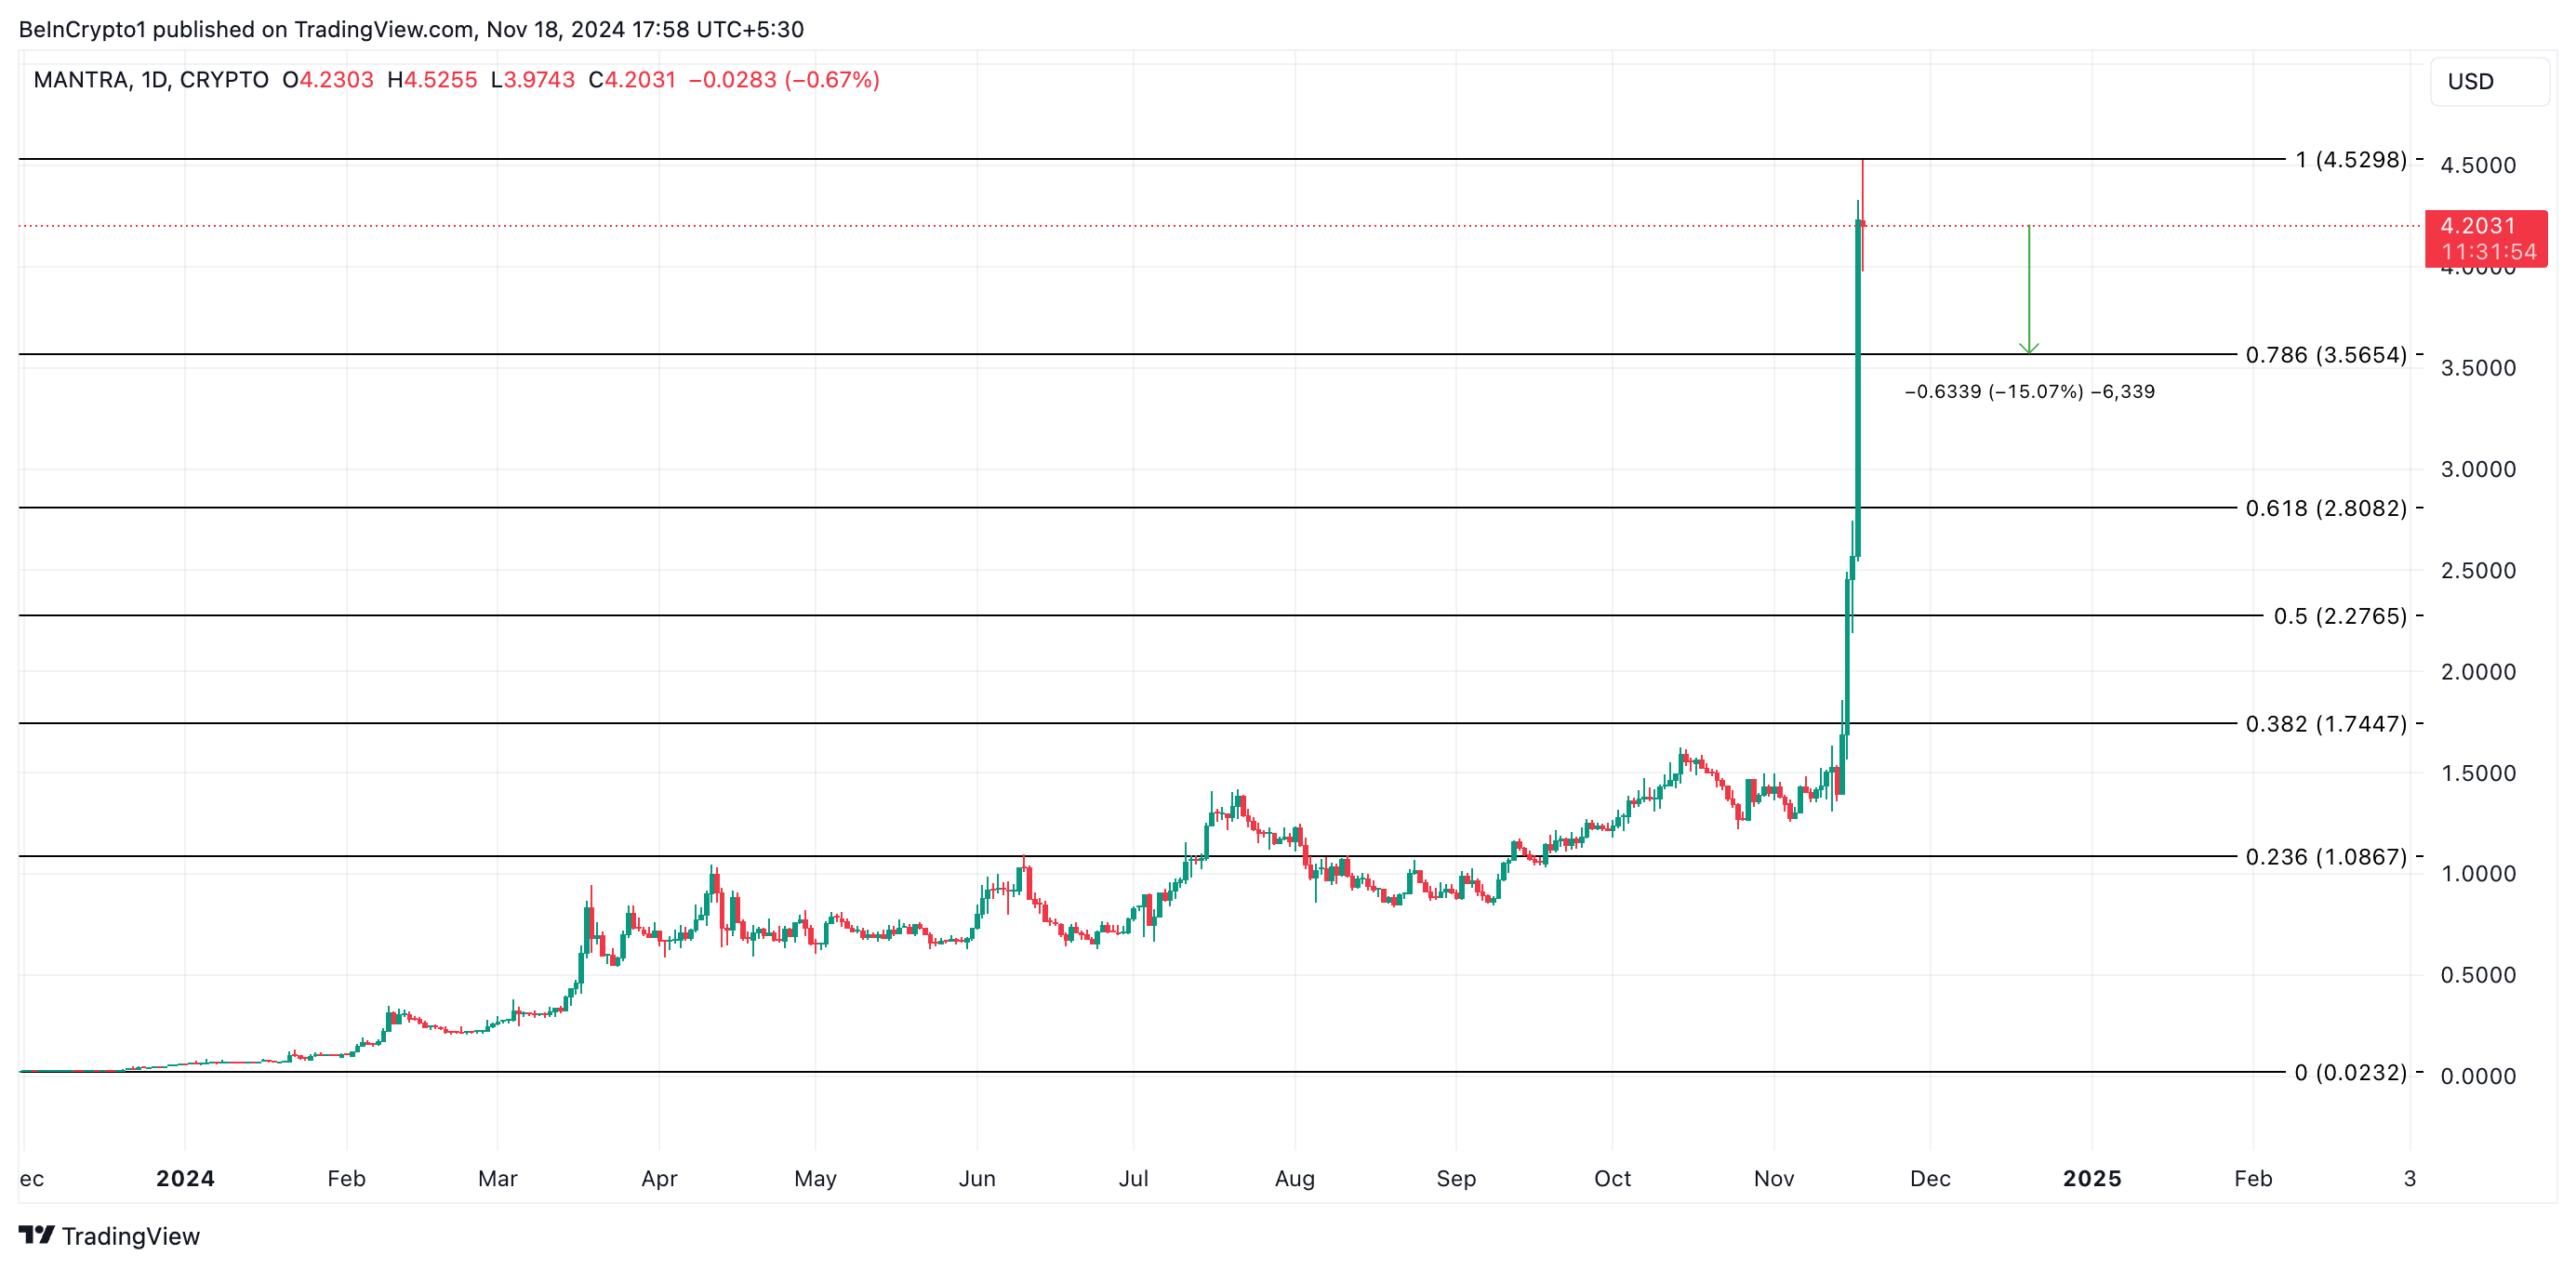
OM, the native token of the real-world asset (RWA) Layer-1 blockchain Mantra, saw a substantial rally, surging over 30% in the last 24 hours. It hit a new all-time high of $4.52 on Monday before pulling back to $4.20, where it currently trades.
Despite the impressive surge, on-chain indicators point to signs that OM’s upward momentum could be slowing. Here’s why.
Mantra Traders Distribute For Profit
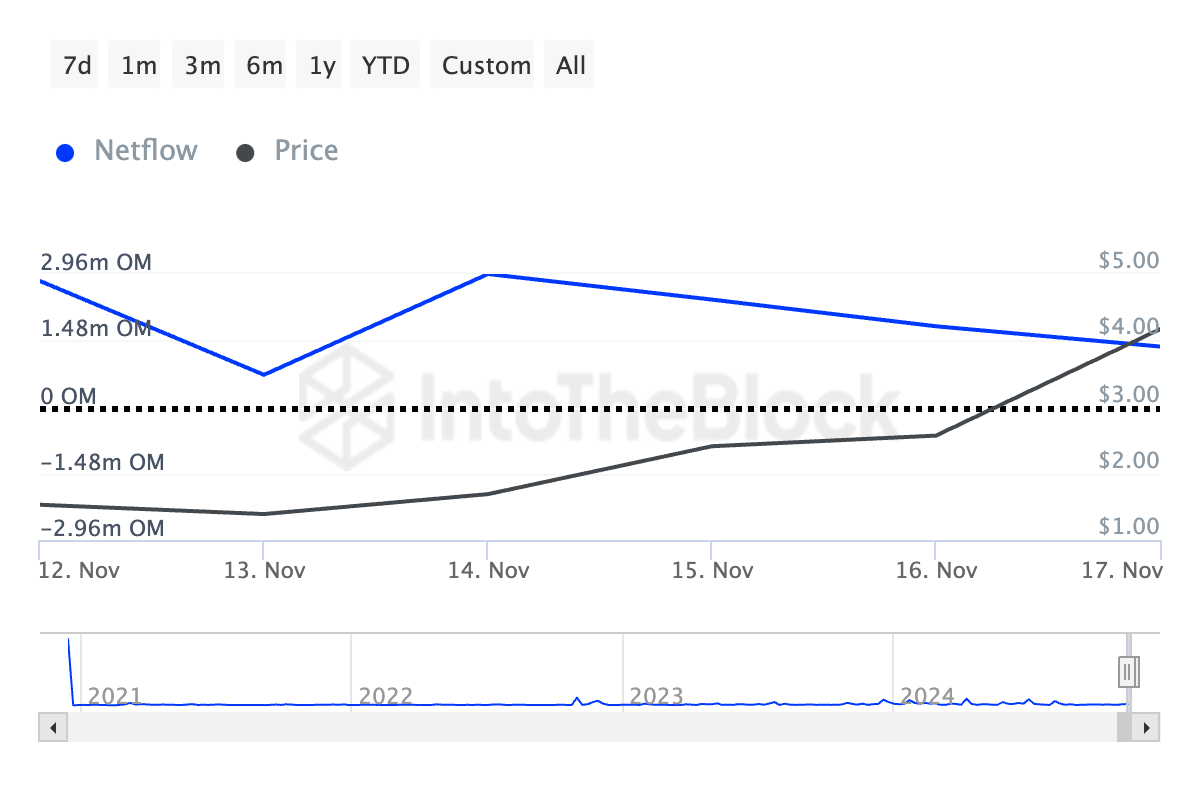
OM’s large holders’ netflow has declined over the past few days. According to IntoTheBlock’s data, it fell by 54% between November 14 and 17. This indicates reduced whale accumulation, which could exert downward pressure on the altcoin’s price.
Large holders are addresses that control more than 0.1% of an asset’s circulating supply. The netflow metric measures the difference between the amount these investors buy and sell over a specific timeframe.
A decline in netflow suggests that whale addresses are reducing their positions, a bearish indicator that may signal increased selling pressure and a heightened risk of a price drop.

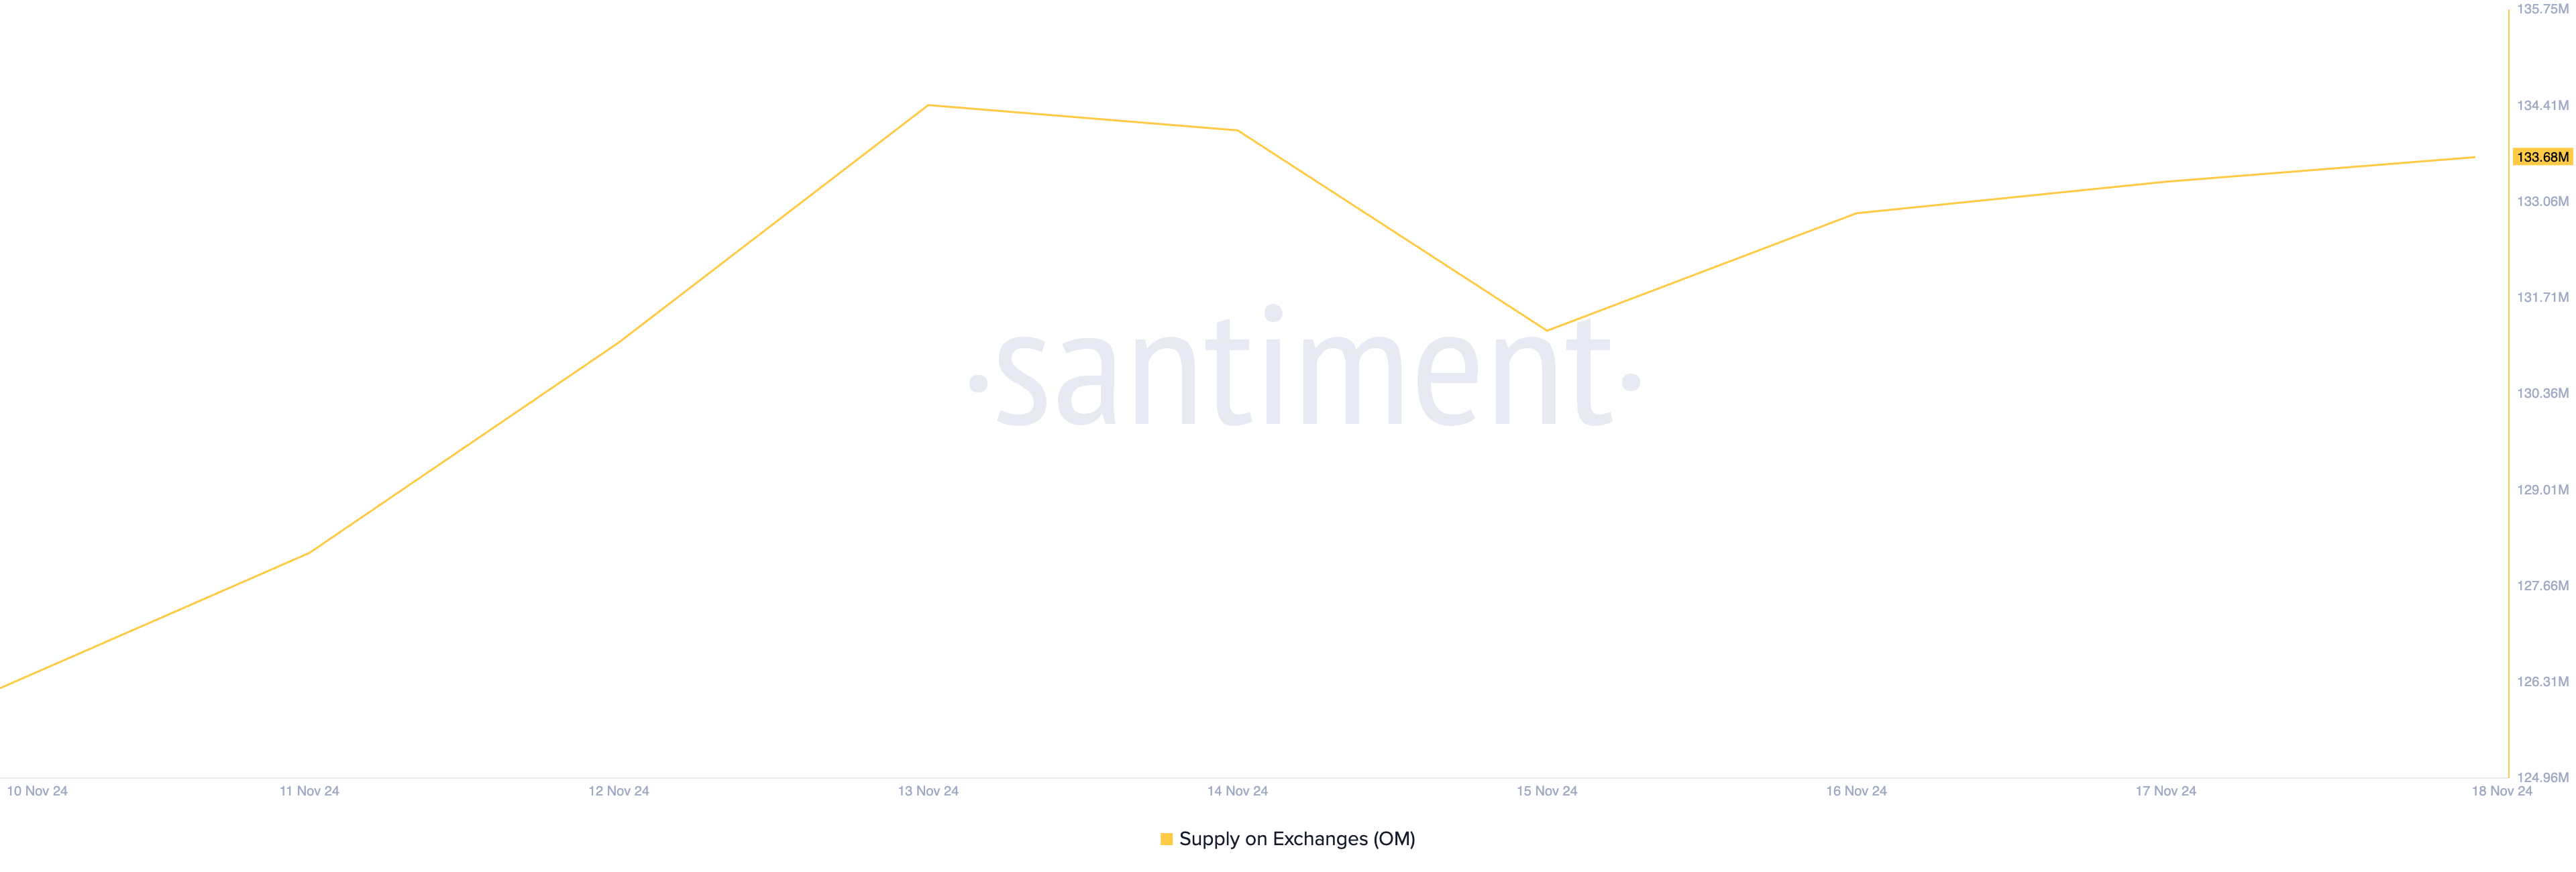
Notably, this decline in large holders’ netflow has been accompanied by a spike in exchange supply, confirming the selloffs. According to Santiment’s data, OM’s supply on cryptocurrency exchanges has increased by 2% over the past three days. As of this writing, 134 million OM tokens valued above $553 million are held within wallets on exchanges.
When an asset experiences a spike in supply on exchanges, it indicates that more tokens are being moved from private wallets to exchange wallets. This suggests that investors may be preparing to sell, leading to increased selling pressure. Such a trend is typically bearish, as it can result in a potential price decline due to heightened supply on the market.

OM Price Prediction: Token Has Two Options
Currently, the RWA asset trades at $4.20. If profit-taking continues, the Mantra token could lose its recent gains, potentially dropping 15% to $3.56. Should bullish momentum weaken further at that level, it may fail to hold as strong support, potentially leading to a deeper decline toward $2.80.

Conversely, a resurgence in buying pressure could drive the token back to its all-time high of $4.52 and possibly beyond.
Disclaimer
In line with the Trust Project guidelines, this price analysis article is for informational purposes only and should not be considered financial or investment advice. BeInCrypto is committed to accurate, unbiased reporting, but market conditions are subject to change without notice. Always conduct your own research and consult with a professional before making any financial decisions. Please note that our Terms and Conditions, Privacy Policy, and Disclaimers have been updated.


