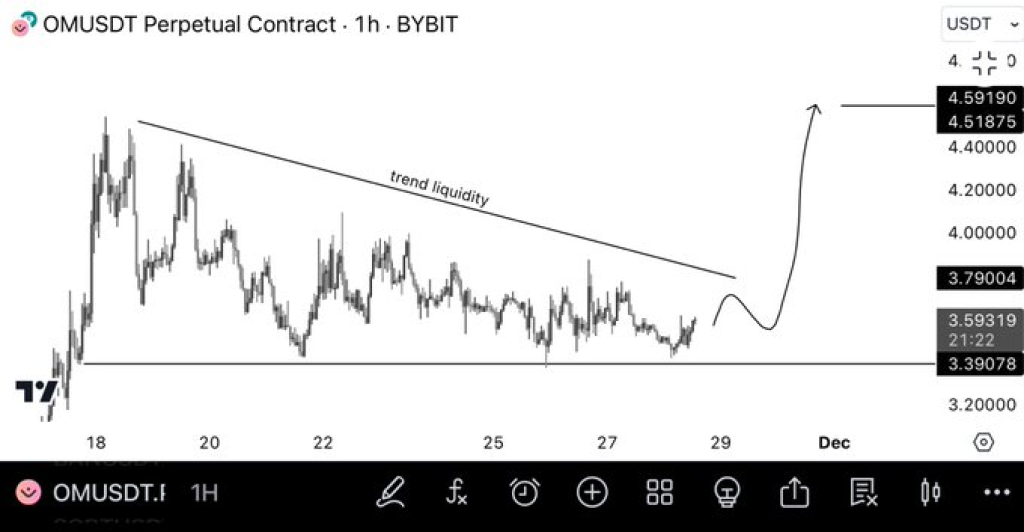

The price of Mantra is moving in interesting patterns and showing sharp increases, which has caught traders’ eyes. Prominent analyst Nihilus points to a potential expansion after a liquidity sweep. The accompanying technical chart on the OM/USDT perpetual contract suggests a breakout could be imminent, potentially driving prices to new heights.
Liquidity Sweep Sparks Anticipation of a Breakout
Nihilus’s tweet, which states, “Liquidity swept. ✅ Expansion soon. ⏳🚀,” refers to a key event in OM’s price action. The chart analysis reveals that OM recently dipped below a strong support level at $3.39, triggering stop-loss orders and clearing liquidity. This move is often seen as a setup for market makers to absorb sell orders before driving the price higher.
The technical analysis highlights a downward-sloping trend line labeled “trend liquidity,” which has acted as resistance. This trend line suggests an area where short positions have accumulated. A breakout above this line could trigger aggressive upward momentum, with the chart projecting potential targets of $4.00 and $4.40-$4.60.
Support at $3.39 Holds Firm Despite Pressure
The $3.39 level has emerged as a critical support zone for OM. Multiple attempts to push the price below this level have failed, underscoring strong buying interest. This support has acted as a launchpad for potential upward moves, with the price consistently rebounding after testing the area.
The chart indicates that this support level served as the foundation for a liquidity sweep, a move designed to clear weaker hands and consolidate buying power. With liquidity now absorbed, the price is positioned to test and potentially break the descending trend line.


Technical Indicators Suggest a Bullish Outlook
Key technical signals point to bullish momentum building for OM’s price. The downward trend, which has dominated recent price action, shows signs of weakening. If the price breaks above the $3.80 mark, it could invalidate the bearish structure and confirm a shift toward an upward trend.
Volume will play a pivotal role in confirming the breakout. Historically, significant price expansions are accompanied by surges in trading activity. A breakout above the trend line could align with this pattern, paving the way for an upward rally.
Traders are eyeing potential trade setups based on the chart analysis. A breakout above $3.80 could open the path to $4.00 and beyond, with subsequent targets at $4.40-$4.60. However, caution is advised, as a move below $3.39 would invalidate the bullish setup and signal a potential downward continuation.
This evolving setup positions OM as a cryptocurrency to watch in the coming days, with the market awaiting confirmation of the anticipated breakout.
Follow us on X (Twitter), CoinMarketCap and Binance Square for more daily crypto updates.
Get all our future calls by joining our FREE Telegram group.
We recommend eToro
Active user community and social features like news feeds, chats for specific coins available for trading.
Wide range of assets: cryptocurrencies alongside other investment products such as stocks and ETFs.
Copy trading: allows users to copy the trades of leading traders, for free.
User-friendly: eToro’s web-based platform and mobile app are user-friendly and easy to navigate.
Source link


