On Saturday, the values of BTC and ETH went down. People are watching closely because the SEC is deciding on 12 BTC-spot ETFs during the current approval period.
Bitcoin (BTC) and Ethereum (ETH) faced losses in the Saturday session, potentially prompting investors to cash in on profits following gains driven by crypto-spot ETF developments. Despite the absence of BTC or ETH-spot ETF-related news influencing investor sentiment, BTC concluded a four-day winning streak.
As of now, the approval window for decisions on 12 BTC-spot ETF applications extends until November 17.
Nevertheless, optimism in the BTC Futures market suggests anticipation of SEC approval for one, some, or all of the BTC-spot ETF applications. BTC Open Interest reached an 18-month high of $16.5 billion on November 11, compared to $12.3 billion on October 11. The upward trajectory in Open Interest serves as a positive signal for BTC prices.
DOGE Experiences a 4% Saturday Surge, Briefly Returning to $0.082
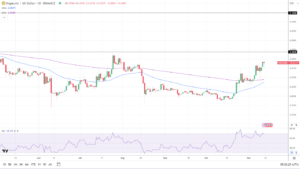
DOGEUSD Daily Chart 121123
On November 12, the DOGE Fear & Greed Index rose, moving from 68 to 69. Positioned in the Greed zone, the Index indicates robust buying demand. However, a potential shift toward the Extreme Greed zone could suggest a pullback as investors consider locking in profits.
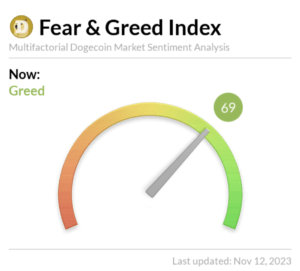
DOGE Fear & Greed Index
CoinMarketCap reported a continuous increase in the number of addresses holding DOGE. On November 11, wallets with 100k+ DOGE totaled 3.48k, compared to 3.32k on November 9. Notably, wallets holding 1k to 100k DOGE numbered 181.12k on November 11, up from 174.39k on November 9.
Whales represented 45.36% of all DOGE holdings, signaling bullish momentum as whale holdings increased from 62.55 billion to 62.64 billion on November 10.
Despite the Saturday gain in DOGE, there were no specific DOGE-related news developments. Meme coins, including DOGE, saw an uptick as investors appeared to shift away from BTC and ETH following gains driven by crypto-spot ETFs. BTC and ETH closed the Saturday session with losses, while shiba inu (SHIB) recorded a 7% increase.
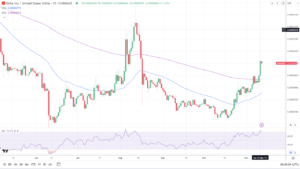
SHIBUSD Daily Chart 121123
Analyzing Technical Aspects of BTC and ETH
BTC Maintains Position Above 50-day and 200-day EMAs. A Breakthrough of the $37,600 Resistance Could Propel Towards Thursday’s Peak at $38,020. Surpassing Resistance at $38,200 Opens the Path to Reach $40,000.
The latest developments in BTC-spot ETF news continue to capture attention. A decline in BTC below the $36,400 support level may bring the $35,265 support level into play.
With a 14-Daily RSI reading of 80.47, BTC remains in the overbought territory. Heightened selling pressure could be anticipated around the $37,600 resistance level.
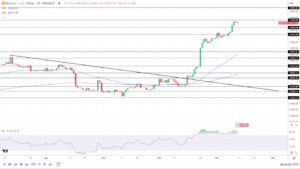
BTCUSD Daily Chart 121123
ETH Maintains Position Above the 50-day and 200-day EMAs. A Rebound to $2,100 Would Propel Toward Friday’s Peak at $2,137 and the $2,143 Resistance Level.
Focus continues on ETH-spot ETF-related developments. Nonetheless, a drop below the $2,021 support level could empower bears to target the $1,926 support level.
With a 14-period Daily RSI reading of 72.53, ETH remains in the overbought territory. Increased selling pressure might be anticipated around the $2,143 resistance level.
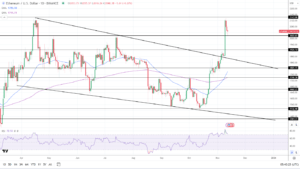
ETHUSD Daily Chart 121123
Important: Please note that this article is only meant to provide information and should not be taken as legal, tax, investment, financial, or any other type of advice.
Join Cryptos Headlines Community
Follow Cryptos Headlines on Google News


