The post Bitcoin Bull Run 2024: How Gold’s Latest High Could Signal a Massive Crypto Surge! appeared first on Coinpedia Fintech News
Can golf predict Bitcoin’s next bull run? It is a sensational question right now in the crypto community. The latest post, regarding the same, made by the founder of Capriole Fund, Charles Edwards, has gained a lot of attention from the members of the crypto community. Lark Davis, a Bitcoin investor, has shared Edwards’ opinion in a short video released in X, inviting people to comment on what they think about the interesting information shared by the Capriole Fund founder. All the prime details of the said developments are below. Go through it if you wish to!
Relation Between Gold and Bitcoin: What Crypto Experts Think
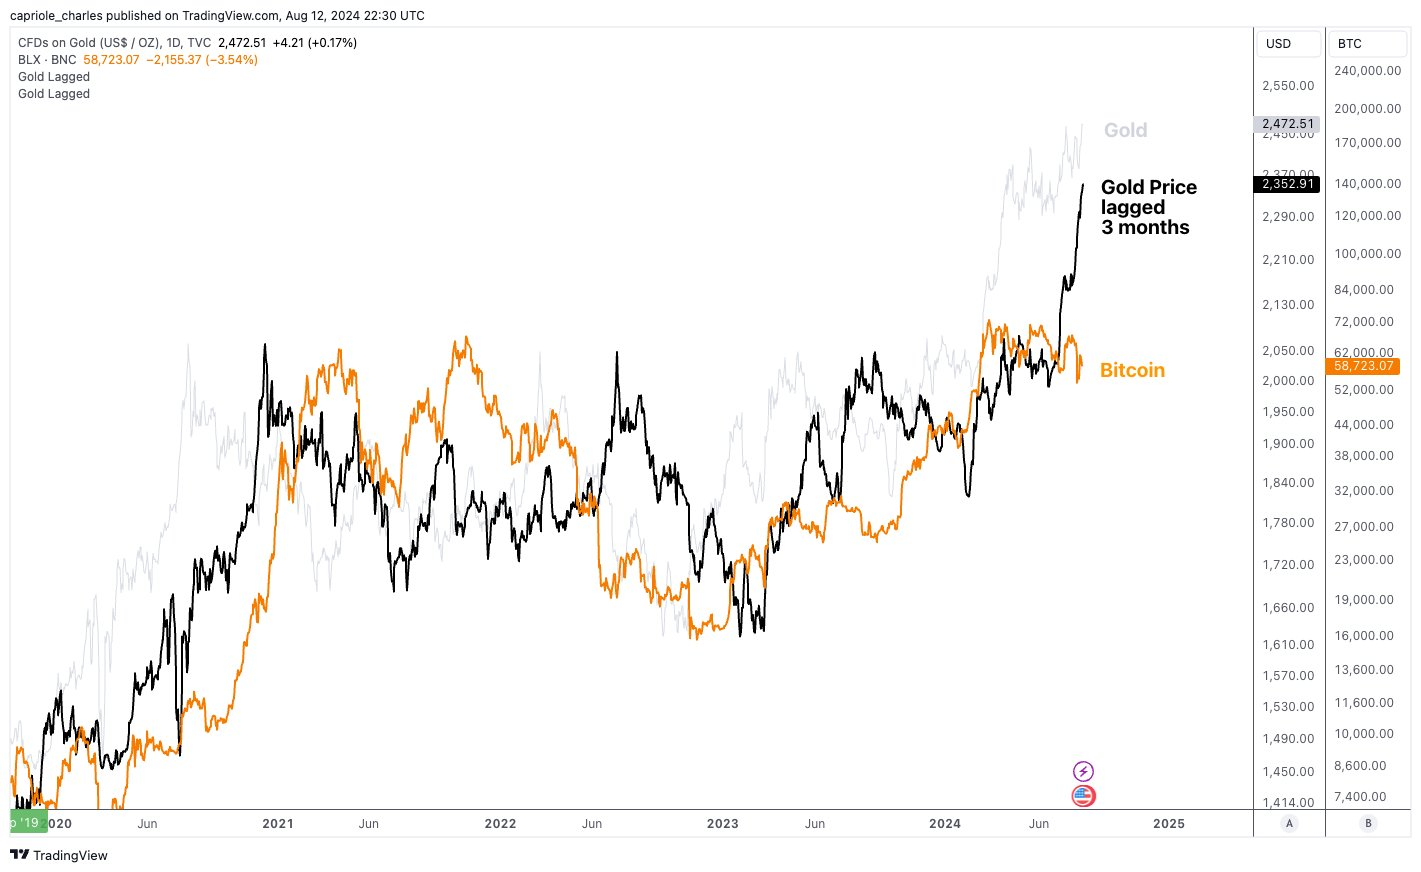
There is directly no relation between gold and bitcoin, other than the fact that both are lucrative assets. But, recently, Edwards identified a powerful correlation between these two assets. He stated that the present price movement of gold might give a hint about the future price movement of Bitcoin. He explained that The major trends in BTC followed the trends in gold by a few months.
In simple words, what Edwards’ post attempts to convey is that if gold is going up, Bitcoin may also start going up a few months later.
Lark Davis, a Bitcoin investor, has shared Edward’s opinion in the form of a short video, on the same platform, X. His video invites people to share what they think about Edward’s opinion.
The chart shared by Edwards shows that gold has touched a new high. If the theory truly is worthy, an upward movement can be expected in the Bitcoin market soon.

Bitcoin Market Landscape: What’s The Current Status
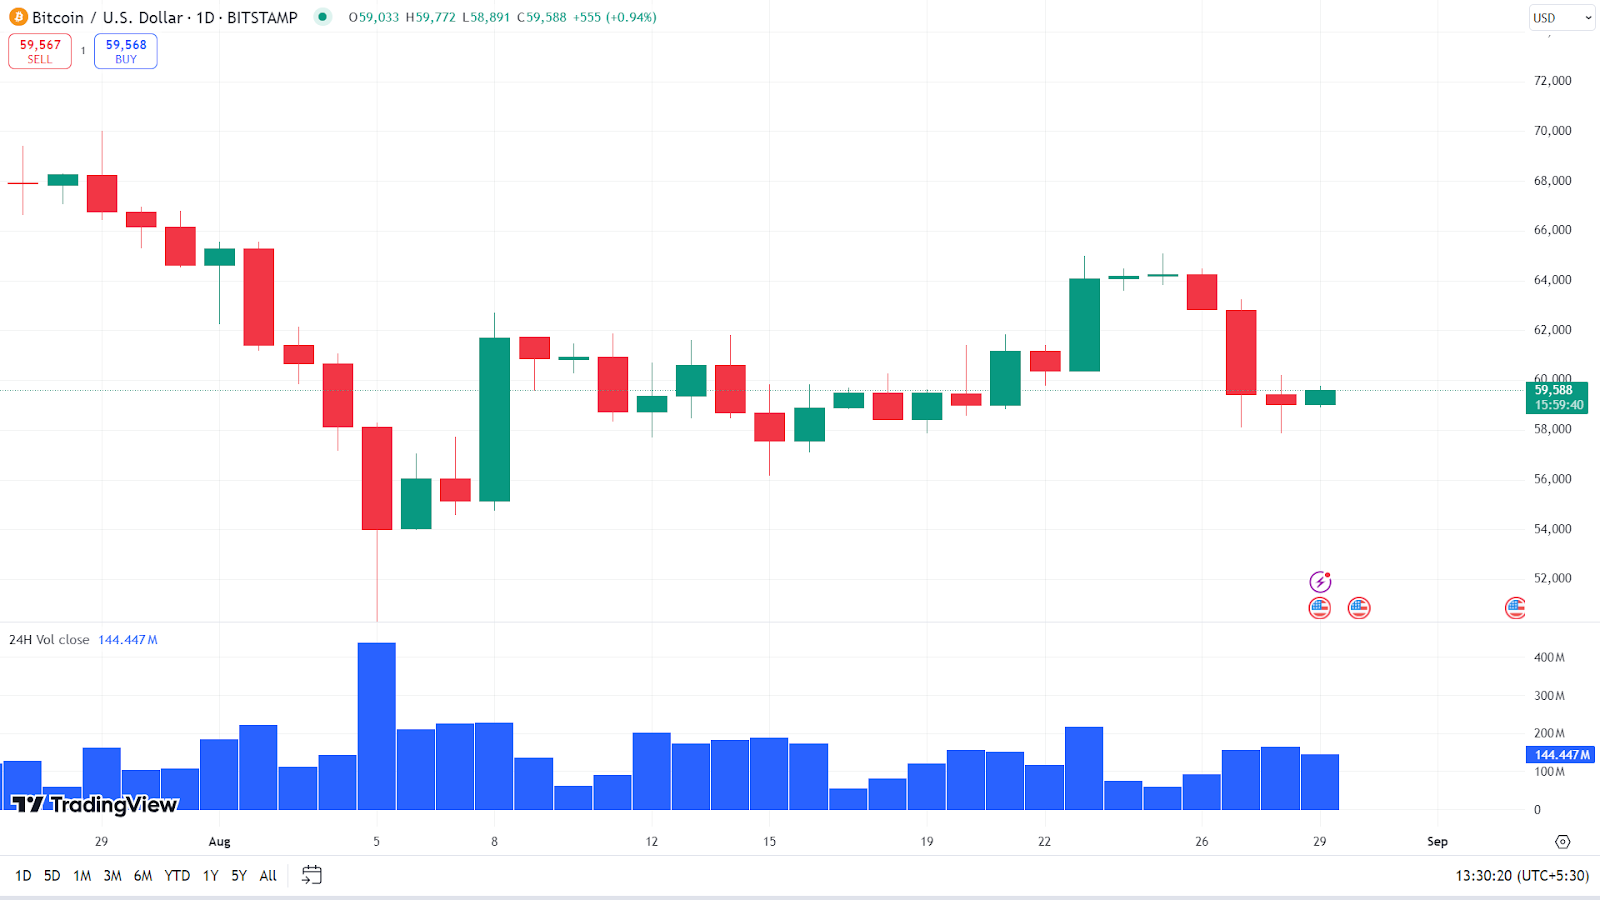
The current price of BTC is just $59,650.84. In the last 30 days alone, the market has seen a fall of at least 10.6%. Likewise, in the last seven days, it has reported a dip of nearly 2.0%.

In the beginning of this month, August, 2024, the Bitcoin market opened with a green candle, in which the price at the time of closing was $65,265. In the following days, at least four large red candlesticks were formed in the one-day chart of Bitcoin. On 5th Aug, when the market touched a bottom, the price stooped to $53,987, affected by the increased volume of $437.756M.
Though on 8th Aug, a long green candlestick was created, it lacked the support of the volume indicator, as on that day, the volume was just $225.652M – far lower than what it was on the day the market was pulled to a bottom. After finding support near $57,670, On 23rd Aug, the market reached a high of $64,115. But the two consecutive doji candlesticks formed post the high indicate that the market was not fully recovered from the strong selling pressure. In the last two days, two strong red candlesticks were formed.
In conclusion, if the observation made by Edward can be believed, the Bitcoin market is marching towards the start of a strong bullish trend. Right now, the chart does not show any strong signs confirming the said possibility. But there are chances that in the coming days the chart will show strong signs if the market sentiment turns in favor of the proposed trend.
Also Read: Crypto News: These Altcoins Are At Risk of Major Crash
The post Bitcoin Bull Run 2024: How Gold’s Latest High Could Signal a Massive Crypto Surge! appeared first on Coinpedia.org.


