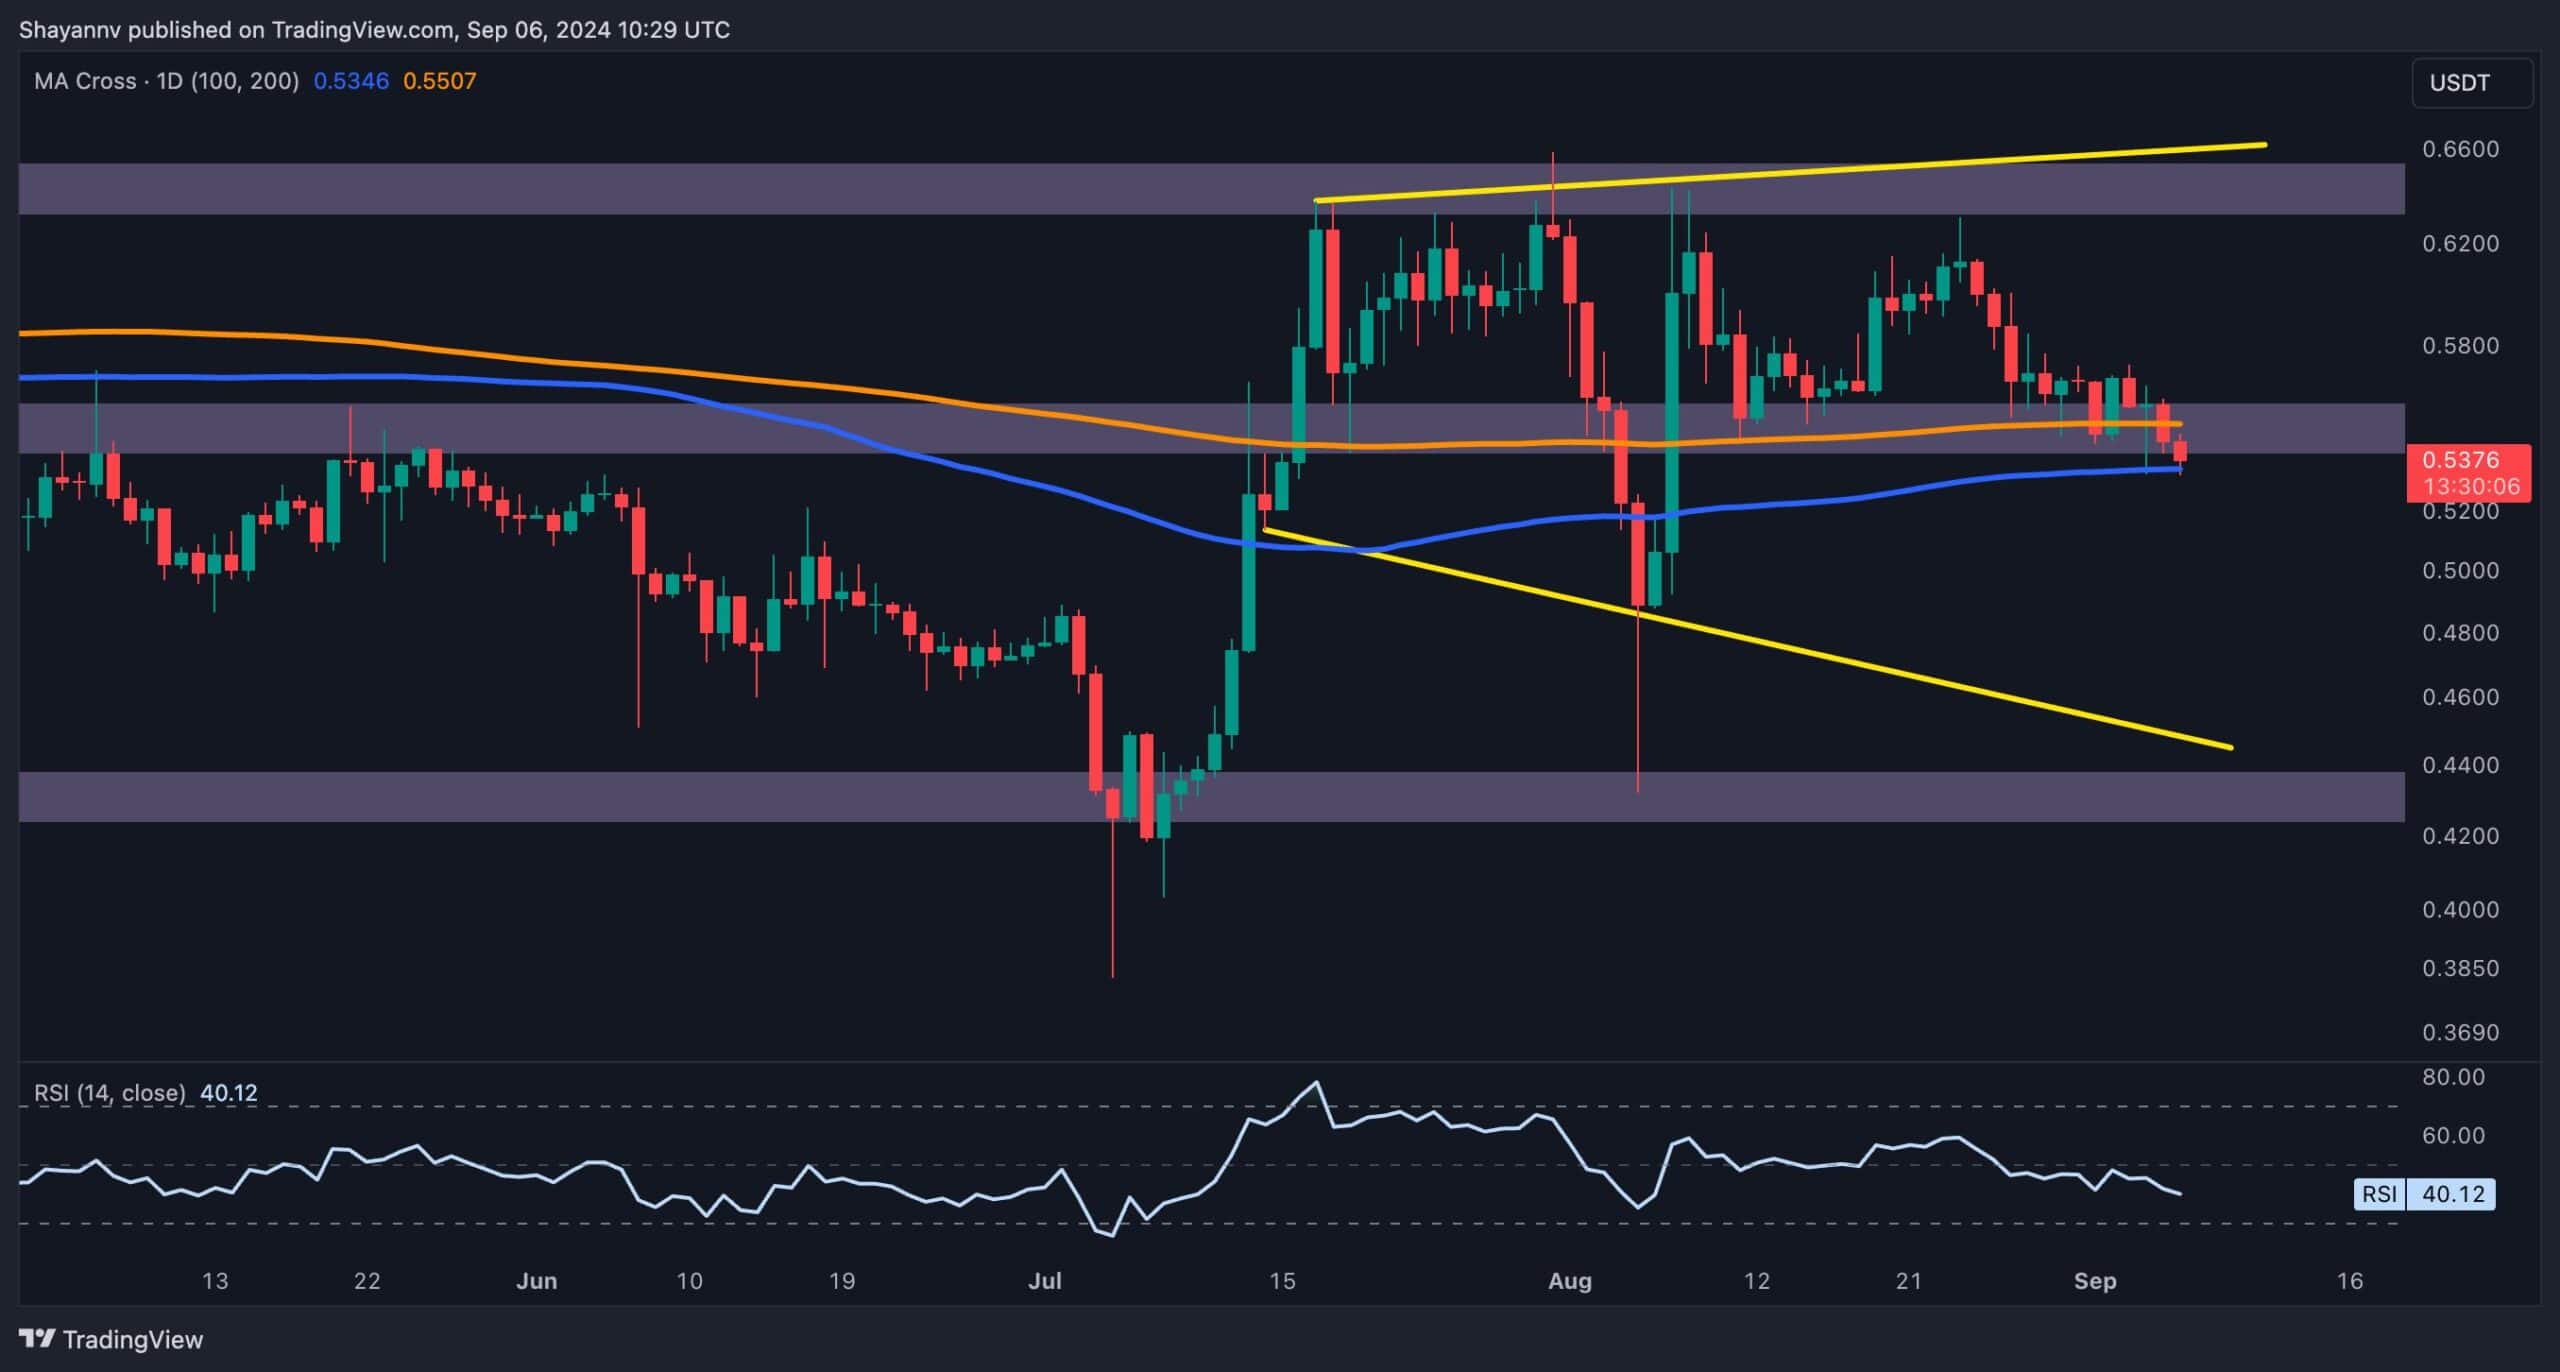
Ripple has presented a solid bearish signal by breaking below the 200-day moving average of $0.55, highlighting the presence of sellers in the market.
However, the price is now battling to breach the 100-day MA at $0.53, and a successful break below this level could trigger a significant decline in the coming days.
By Shayan
The Daily Chart
A close analysis of the daily chart reveals that Ripple has been hovering near the critical 200-day moving average at $0.55, and recently, it slipped slightly below this level. Now, the price is at a pivotal support region, defined by the 100-day moving average of $0.53, which acts as a key barrier.
The overall daily outlook will become bearish if Ripple breaks below this level. If buyers defend this zone and hold the price above both daily MAs, there’s a chance for a bullish reversal. However, based on the current price action, a break below $0.53, leading to further decline, seems more likely.
The 4-Hour Chart
On the 4-hour chart, Ripple remains within a crucial range, with support at $0.53 and resistance around $0.64. The current price action suggests that sellers are increasingly interested in breaking below the $0.53 support zone, which could lead to a significant price drop.
Ripple is currently testing this lower boundary, and a break below it, along with the wedge’s lower boundary, may trigger a liquidation event, pushing the price lower.
In this case, the next downside target lies between the 0.5 and 0.618 Fibonacci retracement levels. Alternatively, if buyers step in and defend the $0.53 level, a rebound toward the $0.60 mark could follow.
Binance Free $600 (CryptoPotato Exclusive): Use this link to register a new account and receive $600 exclusive welcome offer on Binance (full details).
LIMITED OFFER 2024 at BYDFi Exchange: Up to $2,888 welcome reward, use this link to register and open a 100 USDT-M position for free!
Disclaimer: Information found on CryptoPotato is those of writers quoted. It does not represent the opinions of CryptoPotato on whether to buy, sell, or hold any investments. You are advised to conduct your own research before making any investment decisions. Use provided information at your own risk. See Disclaimer for more information.
Cryptocurrency charts by TradingView.


