

- Bitcoin popularity is a small fraction of what it was in March 2024.
- The market capitalization charts gave bullish signals for the long-term.
Bitcoin [BTC] market sentiment was starting to turn bullish. The Crypto Fear and Greed Index stood at 63 to show greed was predominant in the market after BTC raced past the $64k resistance zone.
In a post on X, user Alex Becker noted that despite the excitement within the crypto community, the interest from the wider market was minimal. It was only a fraction of the frenzy seen during the 2020 run.
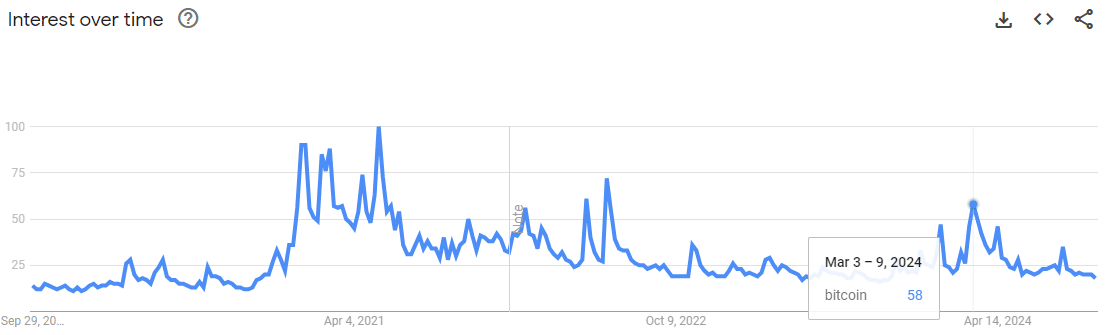
Source: Google Trends
A look at the popularity of the term “Bitcoin” on Google Trends underlines this point. It reached the zenith of its popularity in the first half of 2021. The rally from last October to March 2024 saw BTC popularity reach a score of 58.
In contrast, the score it set last week was 20. This meant that Bitcoin searches are only a third of what they were earlier this year, even as the king of crypto trades just 11% below its all-time high.
AMBCrypto took a closer look at other charts to understand what this means for the wider crypto market.
Bitcoin Dominance is key for understanding capital flow
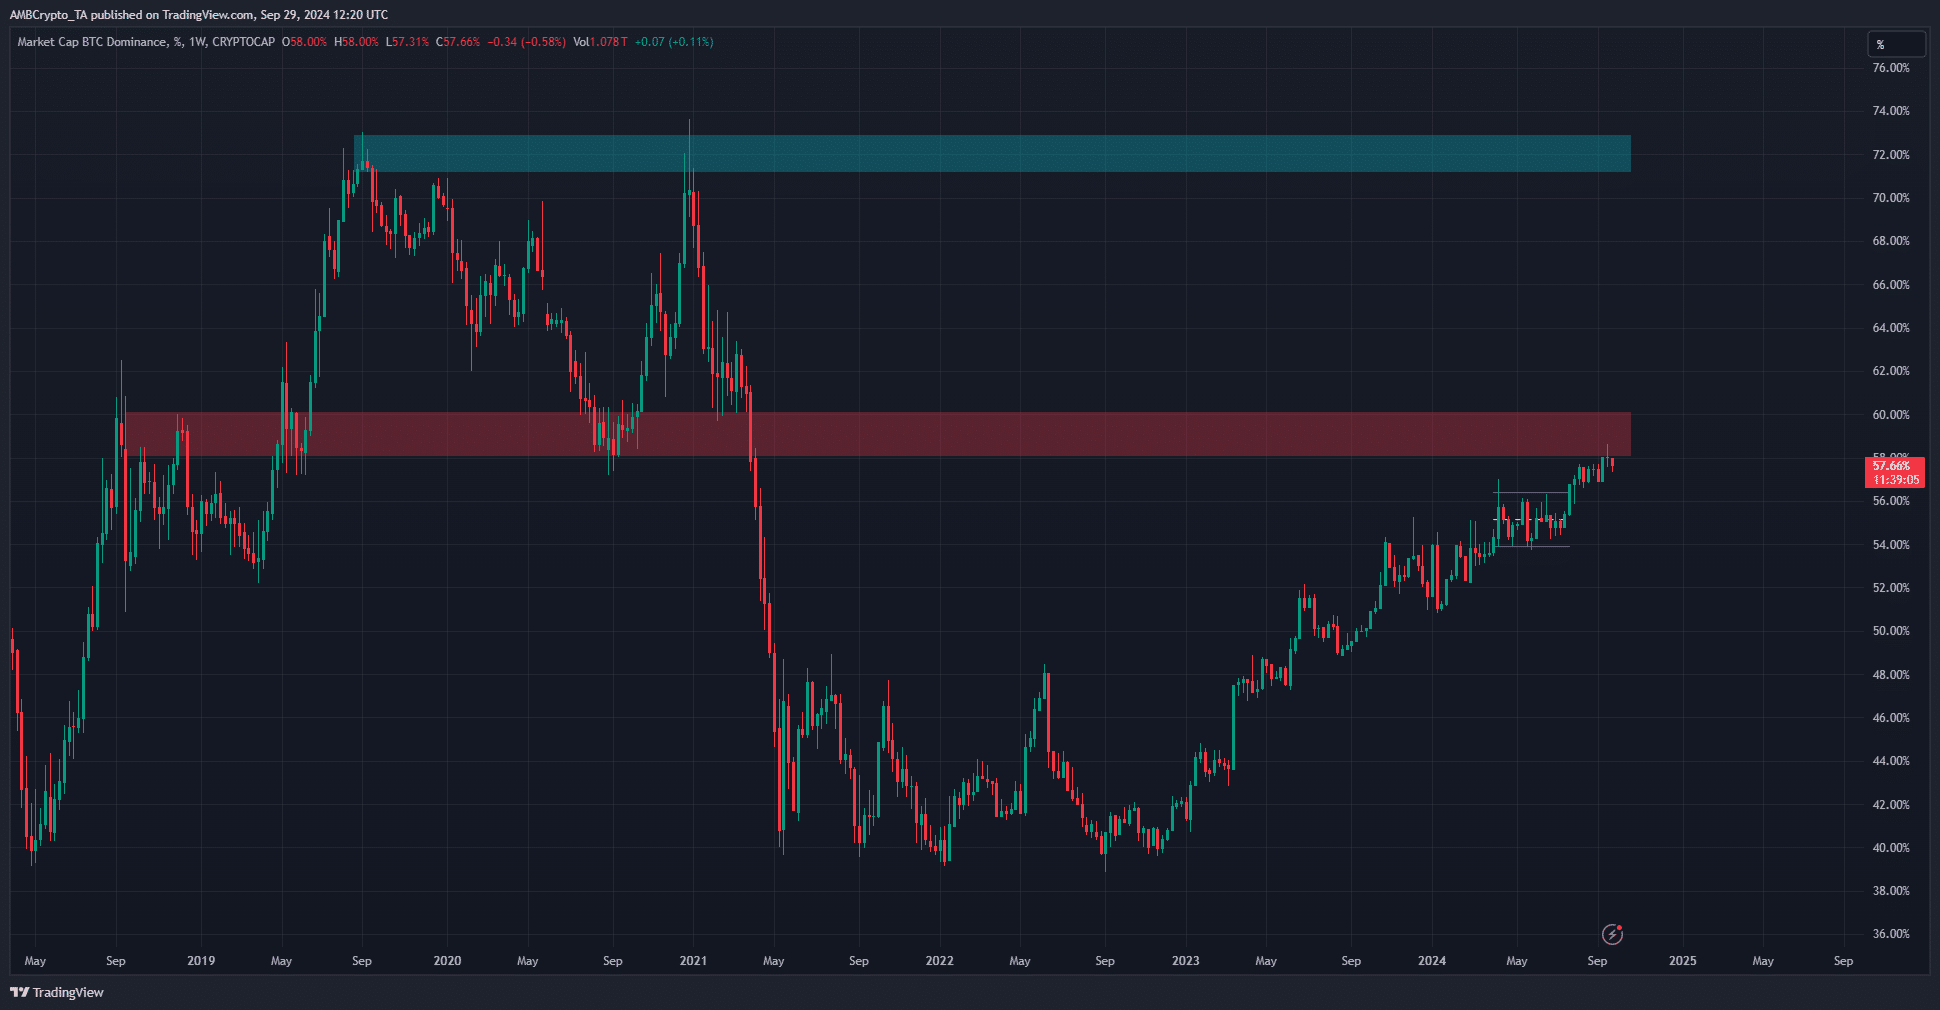
Source: BTC.D on TradingView
At press time, the total crypto market capitalization was $2.3 trillion. The Bitcoin Dominance, or BTC’s share of the total market cap, stood at 57.66%. The weekly chart outlined the 60% area as a resistance zone.
The BTC.D chart generally has an inverse correlation with how well alts perform. A fall in BTC.D means that the altcoin market cap is rising faster than BTC’s, which would be a positive development for the alt market.
However, comparing with the 2020 cycle, we see that it would be ideal if Bitcoin can embark on a long-term uptrend to draw capital to the crypto market. Once it does, this capital can “rotate” into other altcoin sectors, which traders and investors can profit from.
Long-term investors can use this dominance chart to understand whether Bitcoin or the altcoins are the market’s focus at any given time.
Another positive sign for alt season
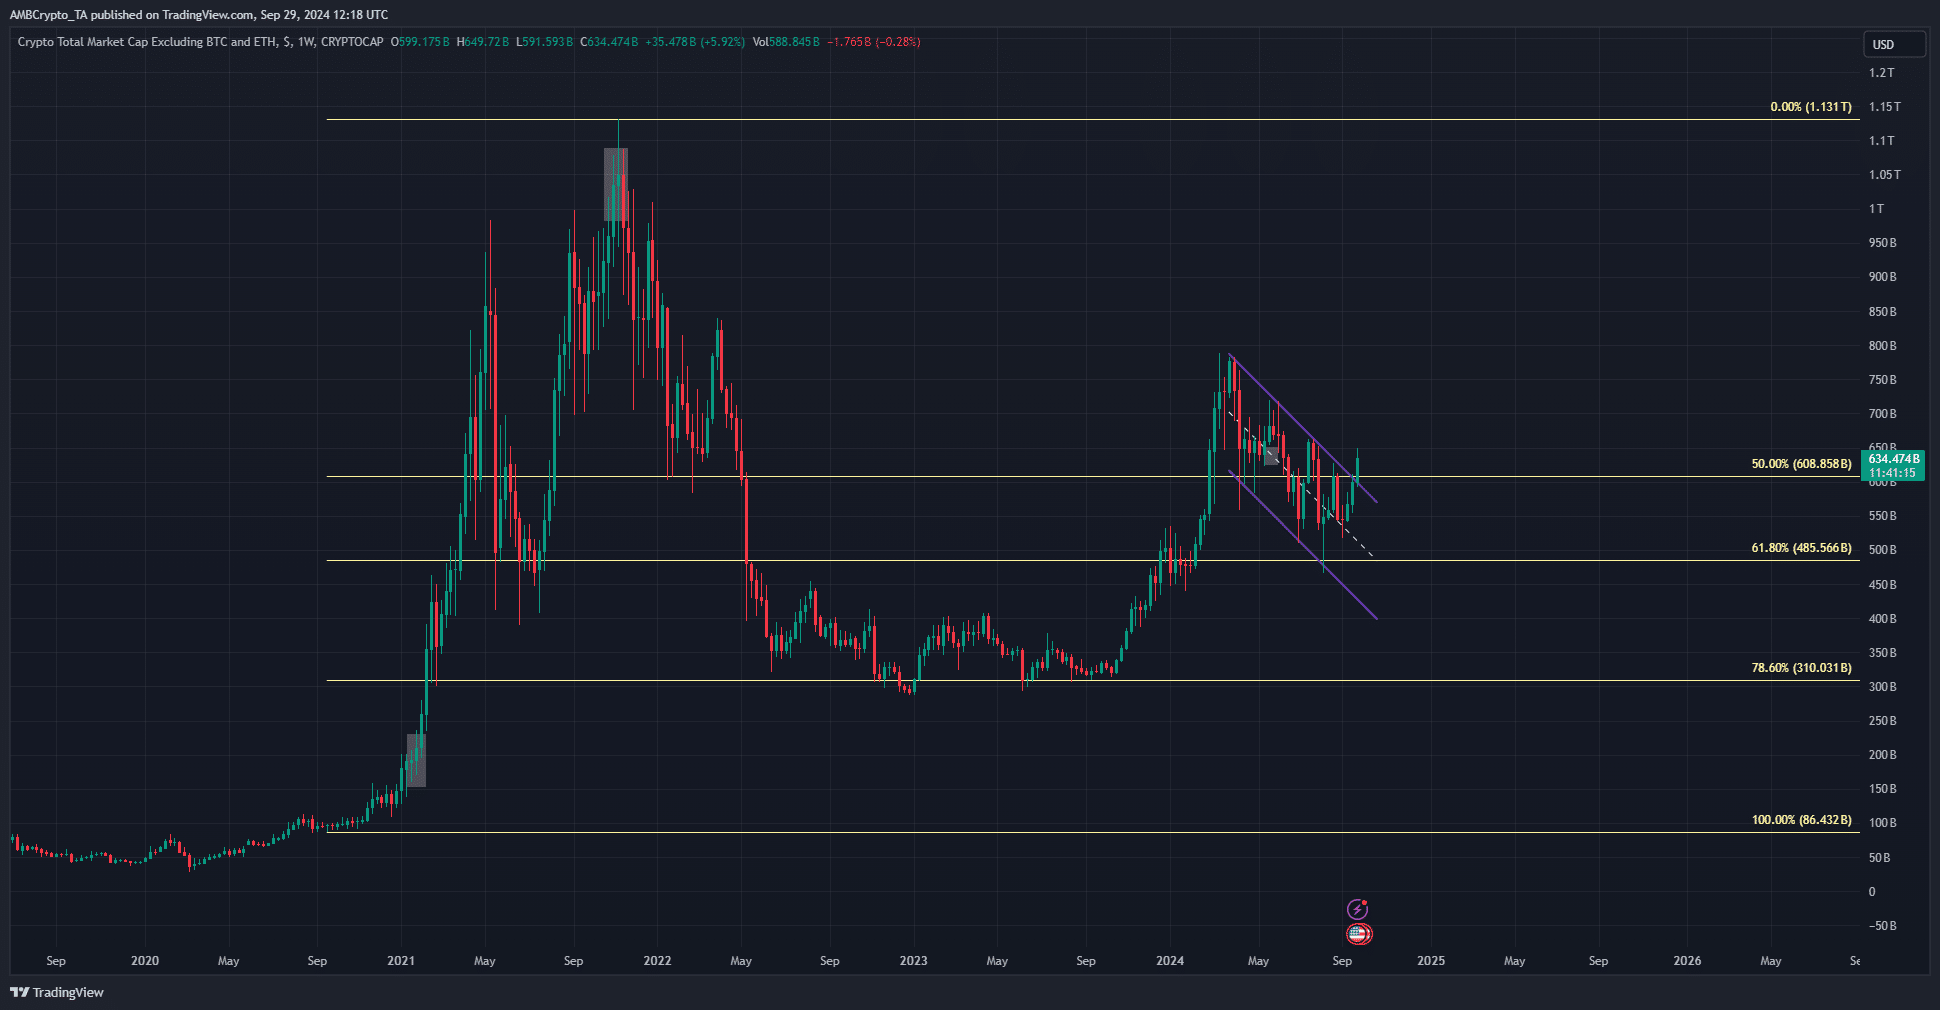
Source: TOTAL3 on TradingView
The market capitalization of the top crypto assets excluding Bitcoin and Ethereum [ETH] are represented on the chart above. It broke out past a descending channel formation.
Read Bitcoin’s [BTC] Price Prediction 2024-25
In doing so, it also breached the 50% Fibonacci retracement level from the 2020 bull run.
This set the stage up nicely for a strong performance from the altcoins in the coming months. From a technical perspective and looking at historic trends, the only way for the crypto market to go is upward over the next 3-6 months.