
- Bitcoin has declined by 5.41% over the past week.
- Market fundamentals suggest a potential upside if Bitcoin closes above 21-week EMA.
After defying expectations in September, Bitcoin [BTC] has had a difficult start in October, a month that’s usually associated with an upswing. As such, over the past week, BTC has experienced a sharp decline.
In fact, as of this writing, Bitcoin was trading at $61980. This marked a 5.41% decline on weekly charts, with the extension of the bearish trend by 0.34% on daily charts.
Prior to this decline, BTC had been on an upward trajectory, hiking by 9.87% on monthly charts.
The current market conditions raise questions about whether BTC will continue with an uptrend, especially following the recent downtrend.
Inasmuch, popular crypto analyst Rekt Capital has suggested a potential rally, citing a 21-week bull market EMA.
What market sentiment suggests
In his analysis, RektCapital posited that 21-week EMA has been successfully retested as support.
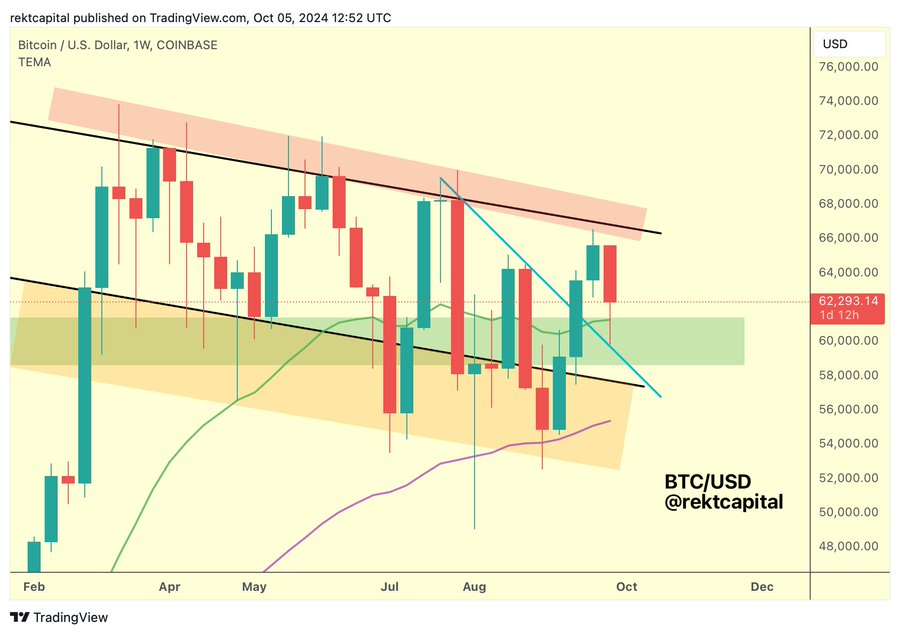
Source: X
As BTC holds above this level, it confirms that the market sentiment remains bullish. This indicates that buyers are entering the market and price action is favoring the upside.
According to this analysis, BTC has broken above a downtrend line that has acted as resistance for months. Such a move is a bullish signal, as it suggests the end of the downtrend and a potential shift in momentum.
Therefore, a strong close above the 21-week EMA and confirmed breakout from the multi-month downtrend would signal further upward momentum, especially after a bullish weekly close above $62k-$63k.
What Bitcoin’s charts suggest
Undoubtedly, the analysis provided by RektCapital offered a promising outlook for BTC. Therefore, it’s essential to determine what other market indicators say.
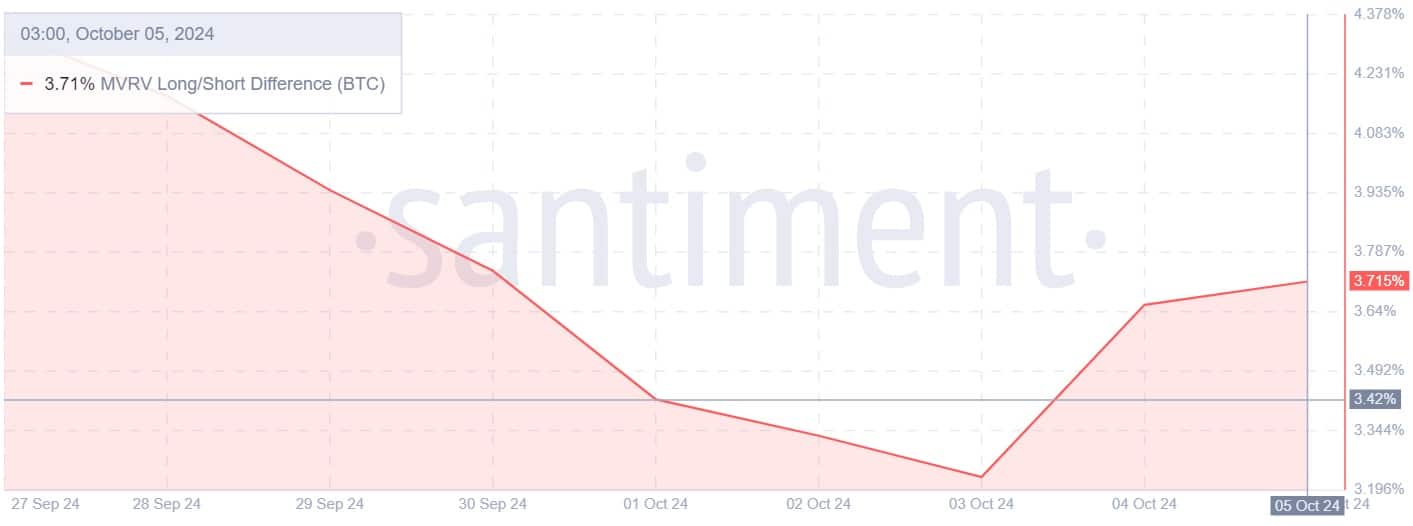
Source: Santiment
The first indicator to consider is Bitcoin’s MVRV long/short difference, which has shifted from downtrend to uptrend.
The MVRV long/short difference has been rising since the 4th of September after declining the previous days.
This suggests that long-term holders are more confident in their positions and less likely to sell s they are already in profit. As the differences rise, it suggests that long-term holders believe in the upside.
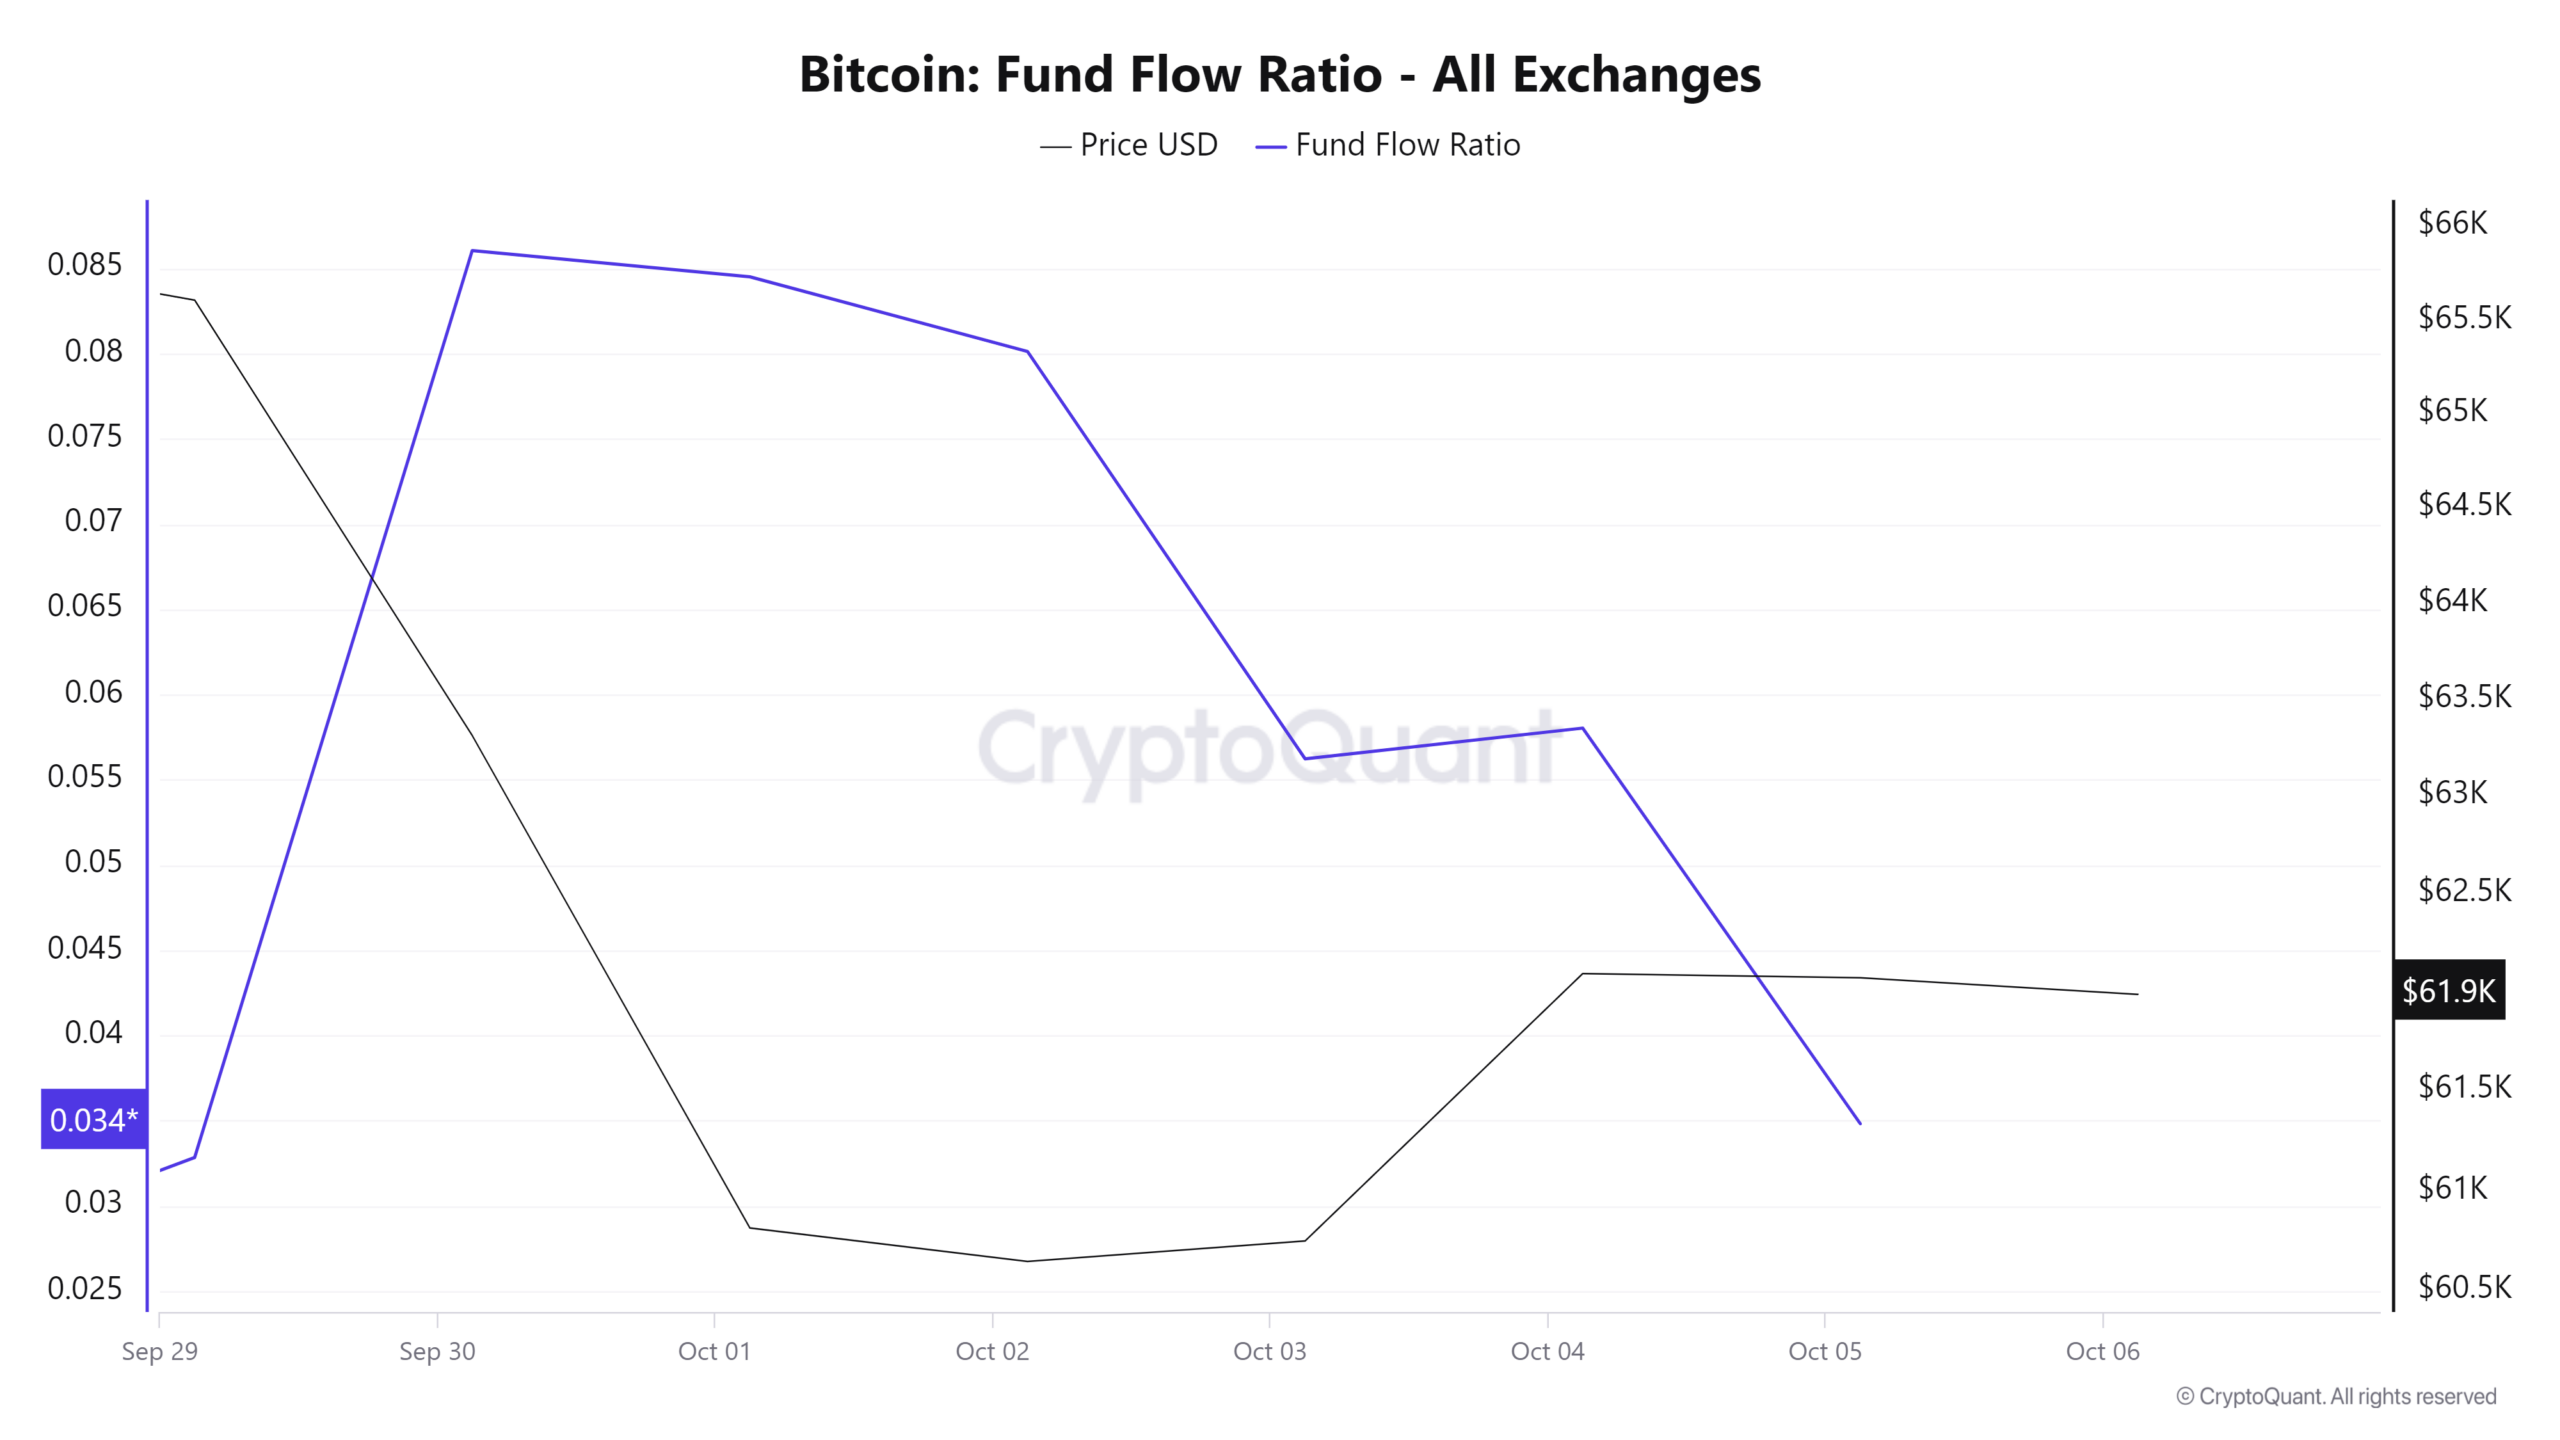
Source: CryptoQuant
Additionally, the Fund flow ratio has been declining for the past six days despite market downturns. This suggests investors are depositing less BTC into exchanges to sell, but instead, they are storing in private wallets.
Such market behavior indicates accumulation as investors anticipate further gains.
Source: Santiment
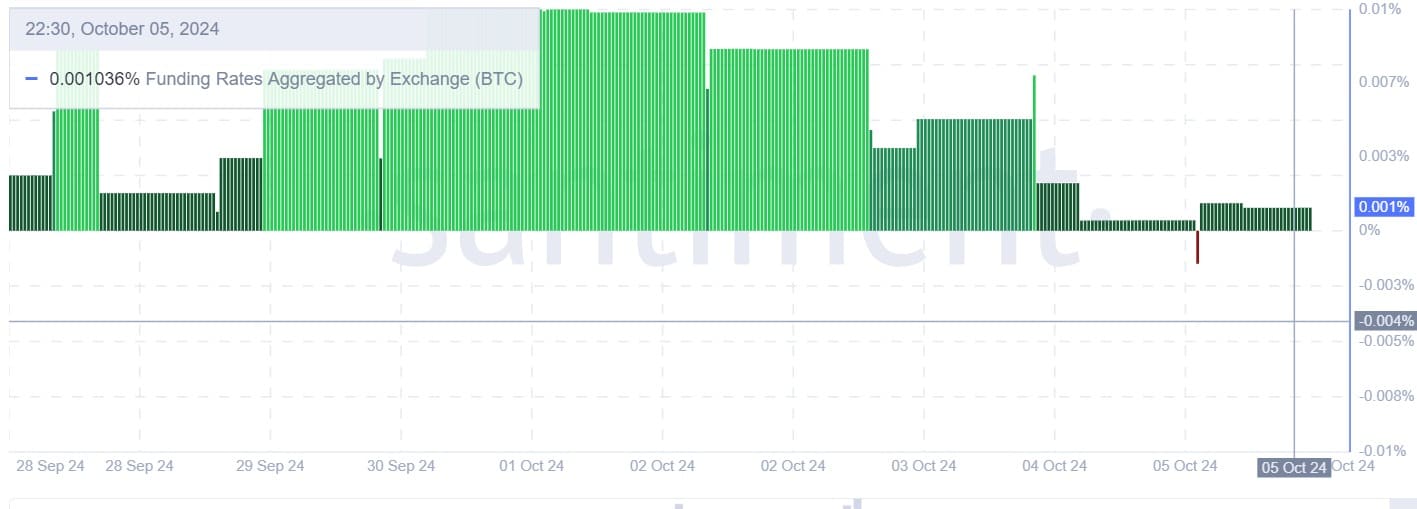
Finally, Bitcoin’s Funding Rate Aggregated by Exchange has remained largely positive throughout the week. This suggests that investors are taking long positions anticipating future price gains.
Read Bitcoin’s [BTC] Price Prediction 2024–2025
Simply put, has been trading sideways over the past few days, with investors increasing accumulation while others take long positions. Such a shift suggests the market is well positioned for further gains.
If the market sentiment holds, BTC will attempt $62785 resistance in the short term.