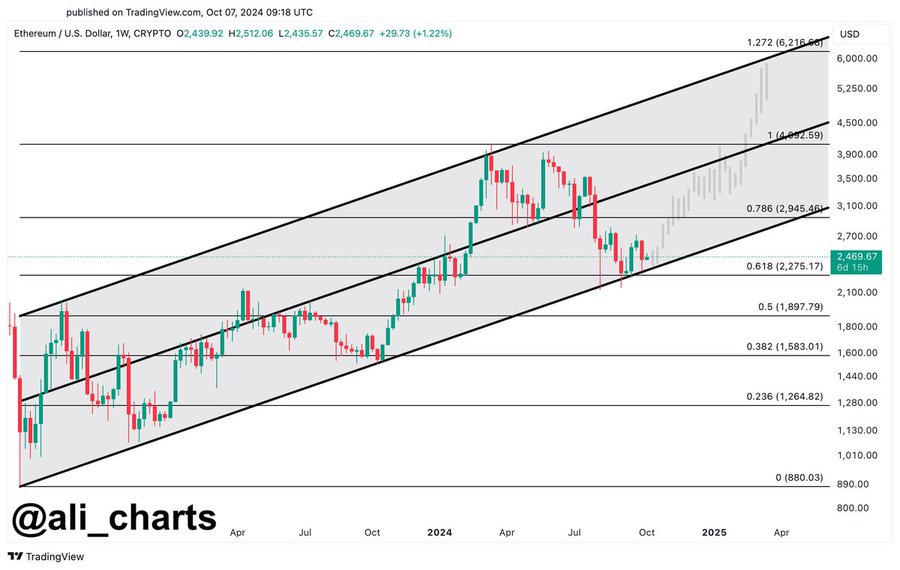
Amid the ongoing market uncertainty, Ethereum (ETH) has reached a critical juncture, as highlighted by market analyst Ali Martinez.
In a recent analysis on X, the market veteran pointed out that the $2,300 support level could determine the future price trajectory of Ethereum, marking either the beginning of a strong rally or a significant decline.
He shared a 1-week chart to corroborate his claims, showing Ethereum’s recent price action moving within a rising channel over the past months.
Ethereum’s Crucial Support
The chart shows that Ethereum is holding well within an ascending channel, with the price gradually approaching the upper bound of the channel. Martinez identified the $2,300 support, which represents a region of heavy buying pressure, as pivotal for Ethereum’s next direction.


If the price remains above the crucial support, it could challenge the next significant Fibonacci level at $4,052. From here, the potential for a rally toward $6,000 becomes more likely.
In a separate report, Martinez noted that approximately 2.77 million addresses accumulated around 52.65 million ETH at the $2,300 support level, making it a strong psychological and technical barrier.
The most significant support level for #Ethereum is at $2,300, where 2.77 million addresses bought 52.65 million $ETH! pic.twitter.com/dgwHOvo20L
— Ali (@ali_charts) October 8, 2024
However, should the bears successfully break below this level, such a development could shift market sentiment to bearish, potentially pushing ETH toward the $1,600 zone, which aligns with the 0.618 Fibonacci retracement level.
Ethereum Short-Term Outlook
Meanwhile, in the short term, Ethereum has been experiencing sideways trading following a recent drop from $2,704 at the end of September. The 1-day chart shows that Ethereum currently trades around $2,422, with little movement in the past few days.
The immediate resistance is at $2,493, as marked by the pivot point. A break above this level could shift market sentiment to bullish, propelling Ethereum toward the next resistance levels at $2,714, $2,850, and $3,071.


On the downside, the nearest support lies at $2,272, which aligns with the 0.618 Fibonacci retracement on the weekly chart, slightly coinciding with $2,300. If Ethereum fails to maintain this level, the next supports are $2,135 and $1,915.
The Directional Movement Index in the daily chart shows the +DI at 20.3, indicating recent stability after a surge, while the -DI has dropped to 22.7. This suggests that bearish momentum is weakening.
However, the ADX is also dropping and currently sits at 20.7, signaling a lack of strong trend direction in the short term. This confirms Ethereum is in a consolidation phase, with a potential breakout imminent depending on whether the $2,493 resistance or $2,272 support is broken.
Disclaimer: This content is informational and should not be considered financial advice. The views expressed in this article may include the author’s personal opinions and do not reflect The Crypto Basic’s opinion. Readers are encouraged to do thorough research before making any investment decisions. The Crypto Basic is not responsible for any financial losses.


