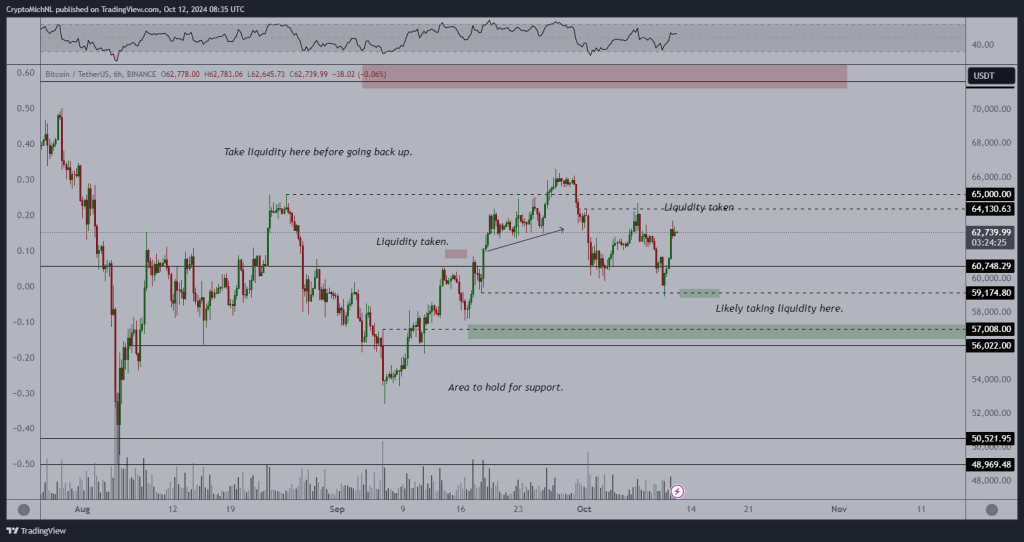

Michaël van de Poppe who has more than 700k followers on X, formerly Twitter, posted a viral Bitcoin chart today and he predicted that the BTC price will move up next week.
Bitcoin is now trading above $63,000, up 1% today. Let’s breakdown his insights.
Analyzing the Bitcoin Chart
Van de Poppe’s chart highlights several key areas of interest for Bitcoin traders and investors. The $59,000 zone is labeled as “likely taking liquidity here,” suggesting that the market may have triggered stop losses or filled large buy orders at this level before rebounding.
This recent dip to around $59,000 served as a crucial support zone, with liquidity being taken at this point. Following this, there was a swift move back up to $62,739, indicating a strong bullish recovery.


The chart also emphasizes a major resistance zone between $64,130 and $65,000. Van de Poppe notes that a breakout of this zone would likely lead to a test of new all-time highs and potentially fuel an altcoin run. This level has historically acted as a significant barrier for Bitcoin’s price action.
Michael’s Bitcoin Price Prediction: Short-Term Expectations
Based on Van de Poppe’s analysis, after the current upward move, a few days of consolidation are expected before a more substantial upward movement. This suggests that Bitcoin might range between $60,748 and $64,130 before attempting a breakout.
The volume profile on the chart appears somewhat muted, indicating that this recovery hasn’t been accompanied by large volume spikes yet. A breakout above $65,000 would likely require a significant increase in buying pressure to sustain the momentum.
Read also: YouTuber Says Kaspa (KAS) Is ‘Easily’ Top 5 Crypto – Here’s Why
The Relative Strength Index (RSI) at the top of the chart shows a downward trend from an overbought level, suggesting that the market has recently cooled off after a strong rally. However, it’s not yet oversold, leaving room for further downside or sideways consolidation before the next leg up.
The chart highlights a major support zone between $57,000 and $56,000. This is a critical level to watch for any dips, as it’s likely where buyers will step in again. On the upside, the $64,130-$65,000 zone remains the key resistance that needs to be broken for a new bullish trend to take shape, potentially leading toward new all-time high tests.
Van de Poppe’s tweet adds important context to this analysis. He suggests that the recent dip to $59,500 was a liquidity-taking event, where larger players forced the price down to trigger stop losses before buying into the liquidity and pushing the price back up.
The analyst forecasts a consolidation period before a more significant breakout next week. This aligns with the chart, showing potential range-bound action between $59,000 and $64,000. The $64,000 – $65,000 range is identified as the key level that, once broken, could lead to new all-time high tests and potentially kick off a major altcoin run.
Follow us on X (Twitter), CoinMarketCap and Binance Square for more daily crypto updates.
Get all our future calls by joining our FREE Telegram group.
We recommend eToro
Active user community and social features like news feeds, chats for specific coins available for trading.
Wide range of assets: cryptocurrencies alongside other investment products such as stocks and ETFs.
Copy trading: allows users to copy the trades of leading traders, for free.
User-friendly: eToro’s web-based platform and mobile app are user-friendly and easy to navigate.
Source link


