Going Through Pivotal Moment In Lead Up To U.S Elections, Crypto Investors Like Cutoshi (CUTO) For Reliable Growth")


- SOL’s price surged by 5.86% this week, with social dominance peaking at over 3.8%
- ARB’s social volume remained low, dropping to 0.09% while the token traded below key moving averages
This week has seen Solana [SOL] register a significant uptrend in price and a surge in social dominance. On the contrary, Arbitrum [ARB] and other L2 assets saw major declines on the social volume and price action front.
Needless to say, this has created a contrasting narrative between these blockchain ecosystems.
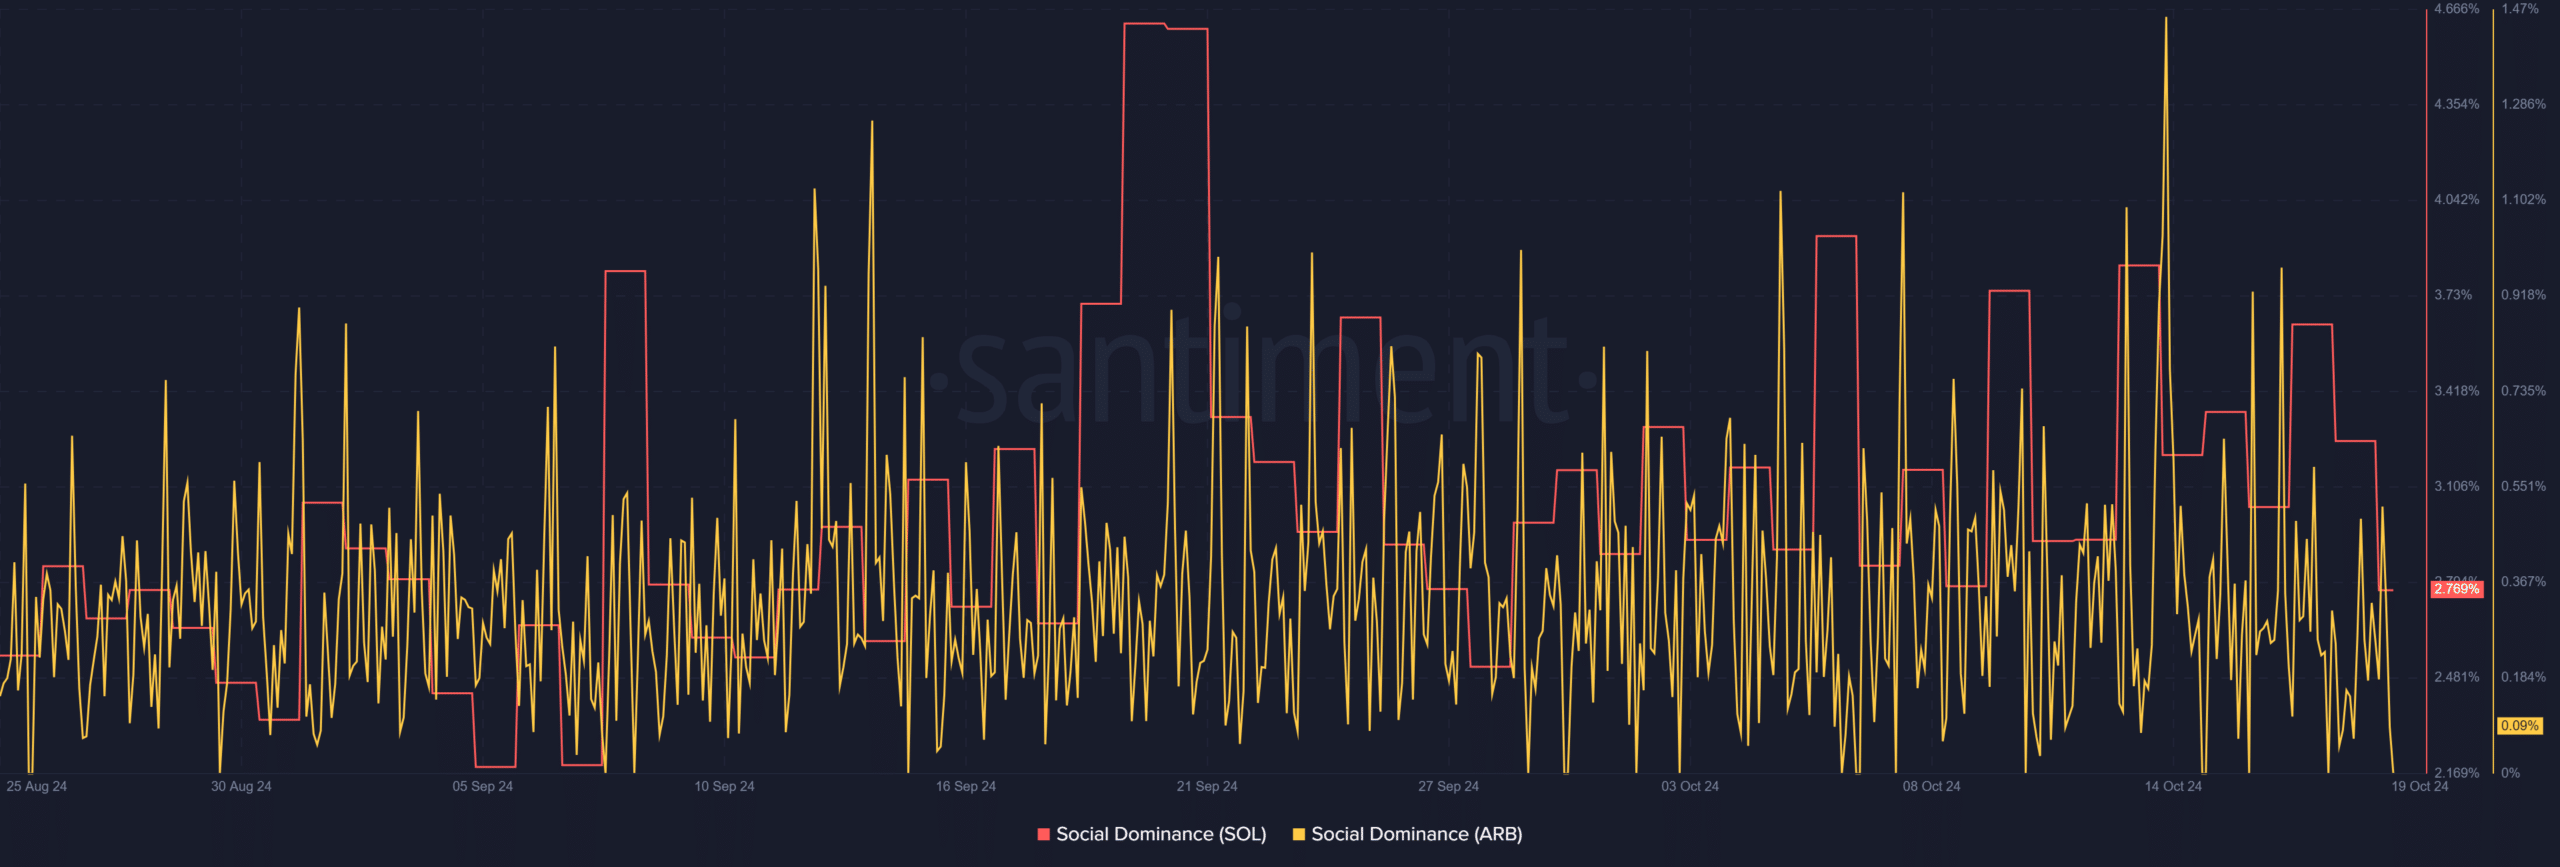
Solana and Arbitrum see divergent social volumes
According to Santiment, the social volume of Solana and Arbitrum followed divergent paths over the last few days. For instance, Solana has seen a notable hike in social volume, rising by over 3% on two separate occasions this week.
On 13 October, the social volume surged to 3.8%. Another spike of 3.6% followed on 17 October.
This indicated that SOL dominated over 3% of all crypto-related discussions during the week.
Worth pointing out though that at press time, Solana’s social volume had fallen slightly to around 2.7%.
Source: Santiment
On the other hand, ARB’s social volume stayed relatively low. While it did see some spikes, the highest was 1.4% on the same day when SOL peaked at 3.8%.
At the time of writing, Arbitrum’s social dominance had dropped further to approximately 0.09%.
Comparing Solana and Arbitrum’s price trends
The daily price chart showed that Solana has been on an uptrend over the past few weeks. For instance, this week, SOL’s price surged to a peak of $163.14 – Representing gains of 5.86% from its most-recent low.
At press time, the price sat above the 50-day Moving Average (MA) of $142.25 and the 200-day MA of $150.71. This highlighted the altcoin’s short-term and long-term bullish trends.
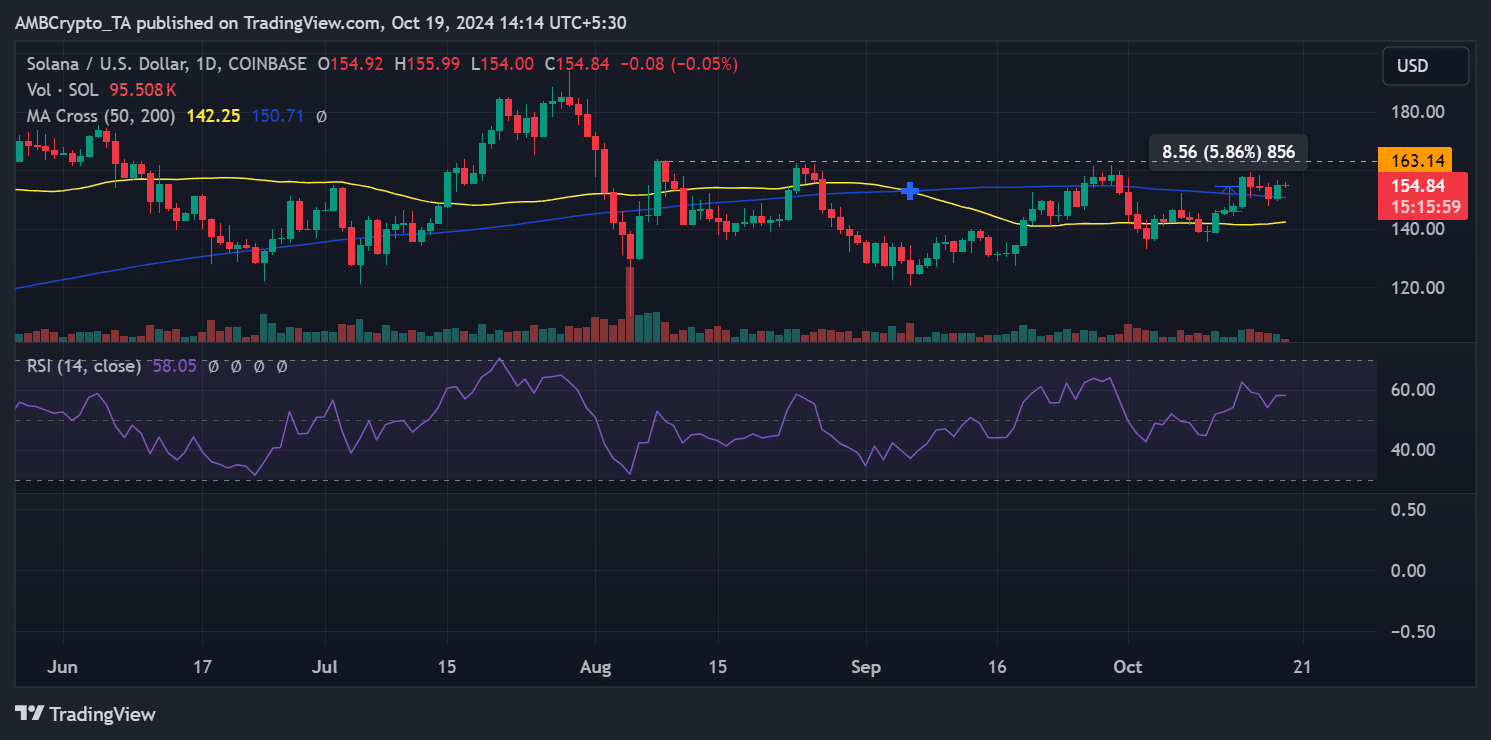
Source: TradingView
Also, SOL’s break above these key moving averages and a neutral Relative Strength Index (RSI) suggested that further upward momentum was possible.
On the flip side, Arbitrum has seen far less upward momentum, only consolidating within a narrow range over the past few weeks. It remained below its 50-day MA of $0.5497 and 200-day MA of $0.8111. This alluded to a bearish trend in the medium term.
The 200-day MA was also significantly higher than the press time price, while the 50-day MA was only slightly above it.
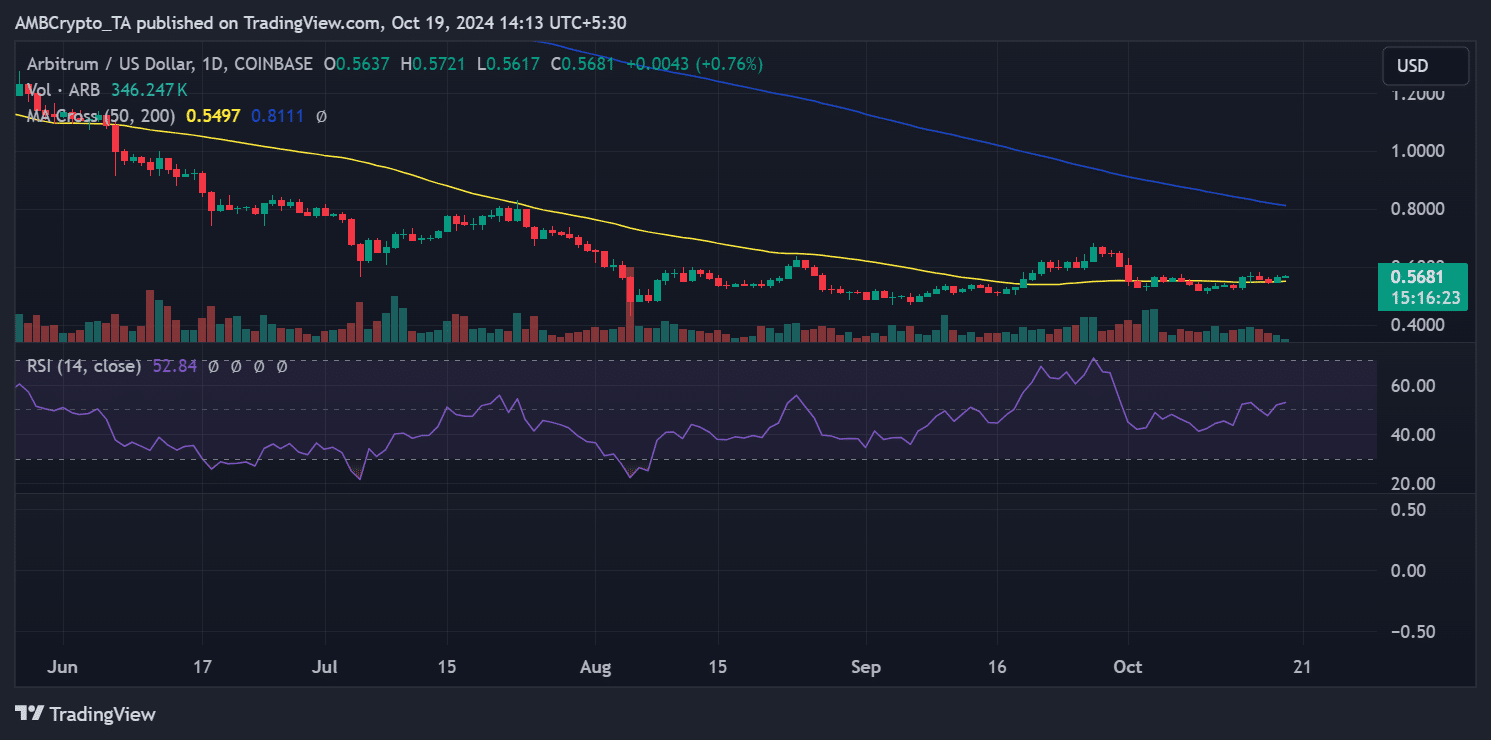
Source: TradingView
SOL and ARB’s future outlook
Solana has been in a stronger position than Arbitrum this week. The token’s break above key moving averages and its RSI nearing overbought territory indicated that buyers have been in control and Solana may be more likely to continue its uptrend.
In contrast, Arbitrum remained in consolidation mode. Although it has started showing signs of recovery, it has not displayed the bullish momentum portrayed by Solana.
ARB will need to break above its 50-day MA to attract more buyers and signal stronger movement.
– Is your portfolio green? Check out the Solana Profit Calculator
That being said, with ARB attracting less attention, as indicated by its lower social dominance, it could offer greater returns if it begins to pump.
Historically, when major coins like SOL have already seen major gains, traders often shift their focus to lesser-known assets like ARB. This could fuel a potential price surge on the charts.