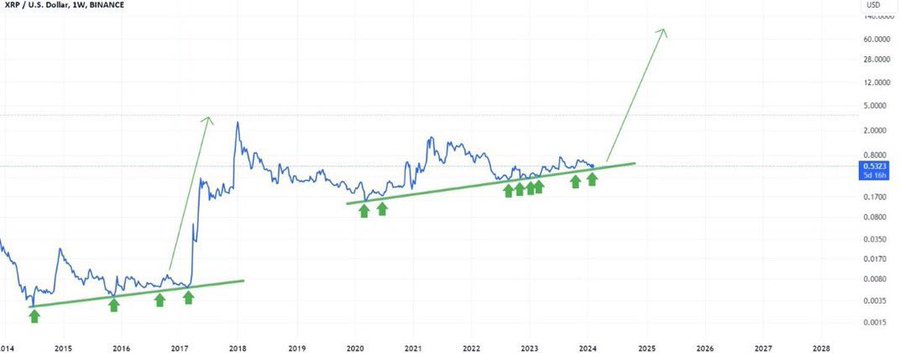
Market analyst Amonyx identifies a bullish 4-year pattern on the XRP weekly chart, asserting that a breakout could lead to a significant price target.
He disclosed this in a recent analysis on X amid XRP’s uncertainty. Amonyx pointed to a strong multi-year bullish pattern that has been forming since 2014. According to him, this pattern is a signal of a massive rally ahead.
Historical Patterns Suggest Massive Breakout
The market watcher based his analysis on XRP’s historical price movements, specifically focusing on a long-term ascending trendline that has consistently acted as support.
This trendline, present since 2020, has been tested multiple times—each instance leading to price rebounds.
Data from the chart shows that XRP recorded a similar trendline from 2014 to 2017, with similar retests and rebiunds. The most notable of these rebounds occurred during the 2017 bull run when XRP skyrocketed from just under $0.01 to the all-time high above $3.31.
Now, XRP appears to be following a similar trajectory, with the trendline again providing strong support over the past few years. According to the chart, XRP’s price is consolidating above this line, hinting at another possible explosive breakout.
Amonyx forecasts that this breakout could propel XRP to over $50, a level that would represent a historic high for the cryptocurrency. The analyst expressed his confidence in this target, suggesting that the goal is already “programmed.”
On-chain data further supports this bullish sentiment. Notably, per Santiment, XRP addresses holding between 1,000 and 1 million tokens have been accumulating more tokens amid ongoing market uncertainty.


These mid-tier holders have collectively added 180 million XRP tokens to their portfolios since July. Analysts often regard this accumulation trend as a precursor to a price rally, as it suggests that investors are positioning themselves ahead of anticipated gains.
XRP Current Position
Meanwhile, XRP continues to face bearish pressure. The asset is currently trading at $0.5718, slightly above the middle Bollinger Band (BB) at $0.5696 and significantly above the lower BB at $0.5005.
However, it remains below the upper BB at $0.6387. This current position suggests that while XRP has some upward momentum, it is still within a consolidation phase.
However, XRP’s Directional Moving Index (DMI) shows that the Average Directional Index (ADX) is at 16.27, suggesting a relatively weak trend strength. Meanwhile, the +DI (21.33) is slightly below the -DI (22.03), indicating that bearish momentum is marginally stronger than bullish momentum.
However, the positioning of XRP within the Bollinger Bands suggests that there could be room for an upward movement.
Since XRP is trading above the middle band, it is in a relatively stronger position than it was during previous tests of the lower band. If XRP can break above the upper BB at $0.6387, it could signal the start of a more significant rally.
Disclaimer: This content is informational and should not be considered financial advice. The views expressed in this article may include the author’s personal opinions and do not reflect The Crypto Basic’s opinion. Readers are encouraged to do thorough research before making any investment decisions. The Crypto Basic is not responsible for any financial losses.


