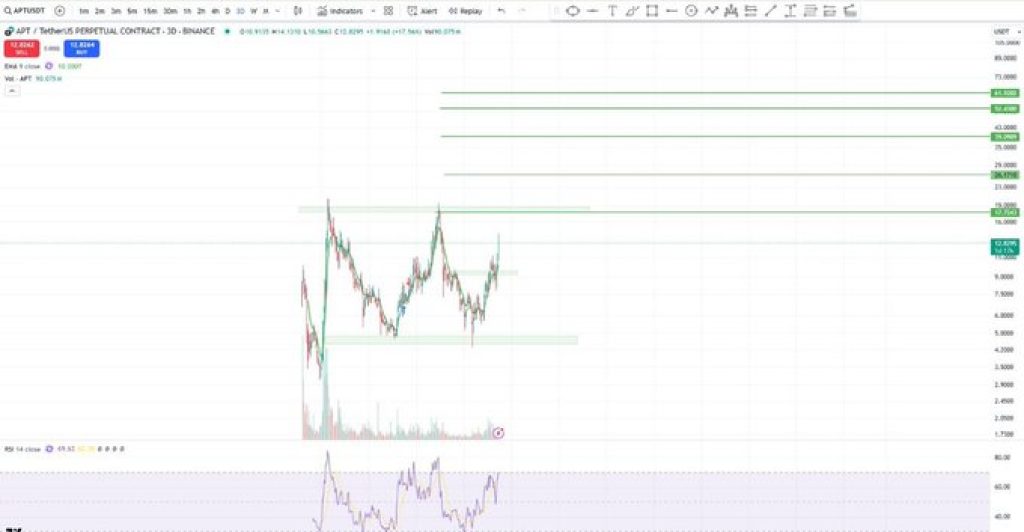

The price of Aptos is approaching key resistance levels, potentially signaling a breakout. Crypto investor Evan Luthra expressed excitement about Aptos, stating, “$APT getting ready to fly! Are you all ready?👀” This has sparked interest among traders watching APT’s price movements and technical indicators, anticipating a possible surge in value.
Aptos Price Movements and Consolidation Pattern
APT has been in a consolidation phase, trading within a defined range with repeated tests of support and resistance levels. This range-bound movement suggests a build-up of momentum, typically a precursor to a significant price move.
Currently, Aptos’ price sits near a resistance zone, around $7.00, which it has tested but not surpassed. If the price breaks this resistance, it could confirm a bullish outlook, aligning with Luthra’s tweet suggesting that APT is “ready to fly.”
On the support side, the price has found stability around $4.50 to $5.00, where it has repeatedly bounced back after declines. A lower fallback support level exists around $3.00, providing an additional safety net should the price reverse. These established support zones strengthen the technical outlook, showing clear boundaries where buying interest is strong.


Key Resistance Zones and Potential Targets
APT faces immediate resistance just above its current price level. Should the $7.00 barrier be breached, the chart suggests further resistance points at approximately $8.50, $10.00, and higher levels extending to $30.
Each of these levels could act as a profit-taking zone, where selling pressure may temporarily slow upward momentum. However, surpassing these targets could create a path for APT’s price to achieve substantial gains, given the strong interest from traders and investors.
Moreover, technical indicators on the APT chart further highlight the potential for a breakout. The Relative Strength Index (RSI) reflects growing buying pressure, currently in a neutral to slightly bullish zone.
A shift into the overbought territory could indicate heightened buying interest, signaling a possible short-term peak if demand weakens. Volume indicators also support the bullish setup, with surges in trading volume during attempts to break out of the consolidation range. Sustained high volume would lend strength to any breakout move, making it more likely to hold.
Read Also: Dogecoin Price Explodes: Meme Coins ‘Can’t Be Ignored’ as Analyst Predicts DOGE at $2.40
Moving Averages and Tweet Sentiment
Exponential Moving Averages (EMAs) on the APT chart show a steady upward trend, suggesting ongoing consolidation with potential for a breakout. These EMAs, likely around the 20- and 50-day marks, have closely tracked the APT price, supporting upward momentum.
Evan Luthra’s tweet adds a sentiment boost, potentially drawing more attention to APT and reinforcing a positive outlook among his followers. His question, “Are you all ready?👀,” suggests optimism for a major upward movement.
Follow us on X (Twitter), CoinMarketCap and Binance Square for more daily crypto updates.
Get all our future calls by joining our FREE Telegram group.
We recommend eToro
Active user community and social features like news feeds, chats for specific coins available for trading.
Wide range of assets: cryptocurrencies alongside other investment products such as stocks and ETFs.
Copy trading: allows users to copy the trades of leading traders, for free.
User-friendly: eToro’s web-based platform and mobile app are user-friendly and easy to navigate.
Source link


