With a bullish recovery in the broader market, the meme coins and the AI tokens are back in trend. As the buying pressure increases, these community and hype-driven tokens are making new highs with a potential breakout rally ahead.
Amid the resurfacing demand, here are the top three meme coins breakout rallies you can’t afford to miss out on. So, let’s take a closer look at the price chart of these top meme coins for a more decisive analysis.
Top Meme Coins Ready For Breakout Rally
Dogecoin (DOGE)
With a huge falling wedge pattern in the daily chart, the Doge price action reveals a bearish trend in motion. However, the recent bull cycle in the meme coin with a positive weekend increases the possibility of a breakout rally.

Despite the impending death cross over the price chart, the meme coin has increased by 12% in three days and is currently trading at $0.10332. As it reclaims the psychological mark of $0.10, the MACD indicator gives a buy signal with a positive crossover.
Currently, the meme coin is ready to challenge the 50-day EMA and the overhead resistance trendline. Based on the price action levels, the breakout rally could signal a price surge to $0.1984 or $0.14009.
Will DOGE’s wedge breakout result in a new all-time high? Find out now in Coinpedia’s DOGE price prediction.
Dogwifhat (WIF)
With a similar huge falling wedge pattern, the WIF token is in a bearish trend. However, the meme coin takes a lateral route after reaching the crucial support level of $1.25.
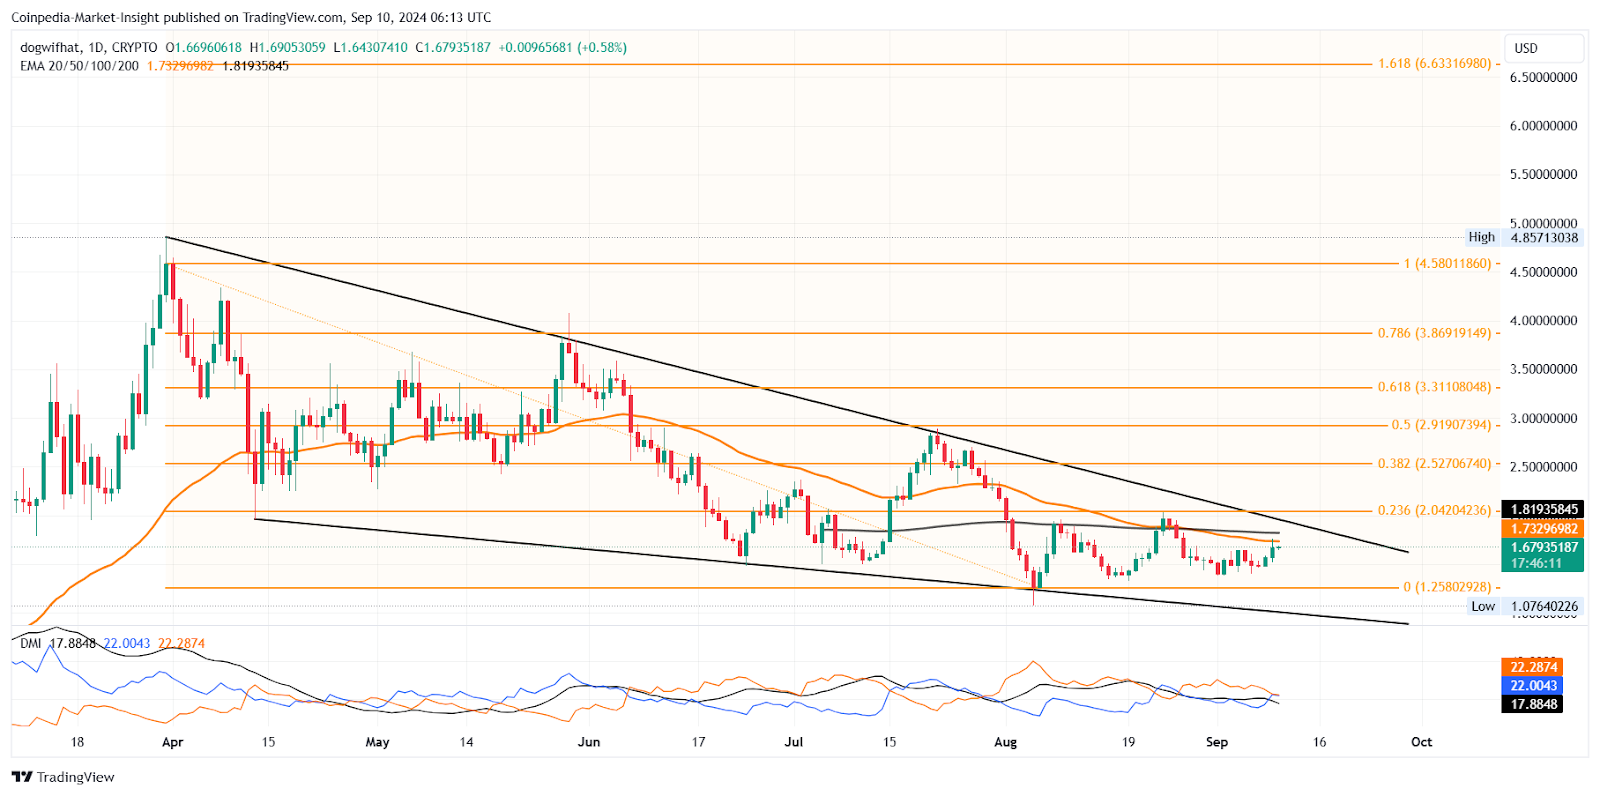
Currently, the meme coin is facing heat from the 50-day EMA that recently gave a death cross with the 200-day EMA. However, the bull cycle within the falling wedge will likely gain momentum as the MACD indicator gives a bullish crossover, and two consecutive bullish candles account for a price jump of 13.52%.
Currently, the meme coin is trading at $1.67 and is ready to surpass the 50-day EMA. A dynamic resistance breakout will challenge the overhead resistance trendline before reaching the $2.00 psychological mark.
This breakout rally will potentially surge the meme coin back to its 52-week high near the $4.58. Hence, with a massive upside of almost 200%, this is a breakout rally one cannot afford to miss.
PEPE
In the daily chart, the PEPE price action reveals a falling wedge pattern during the correction phase. However, the recently formed local support trendline forms a falling wedge pattern with the overhead resistance trendline.
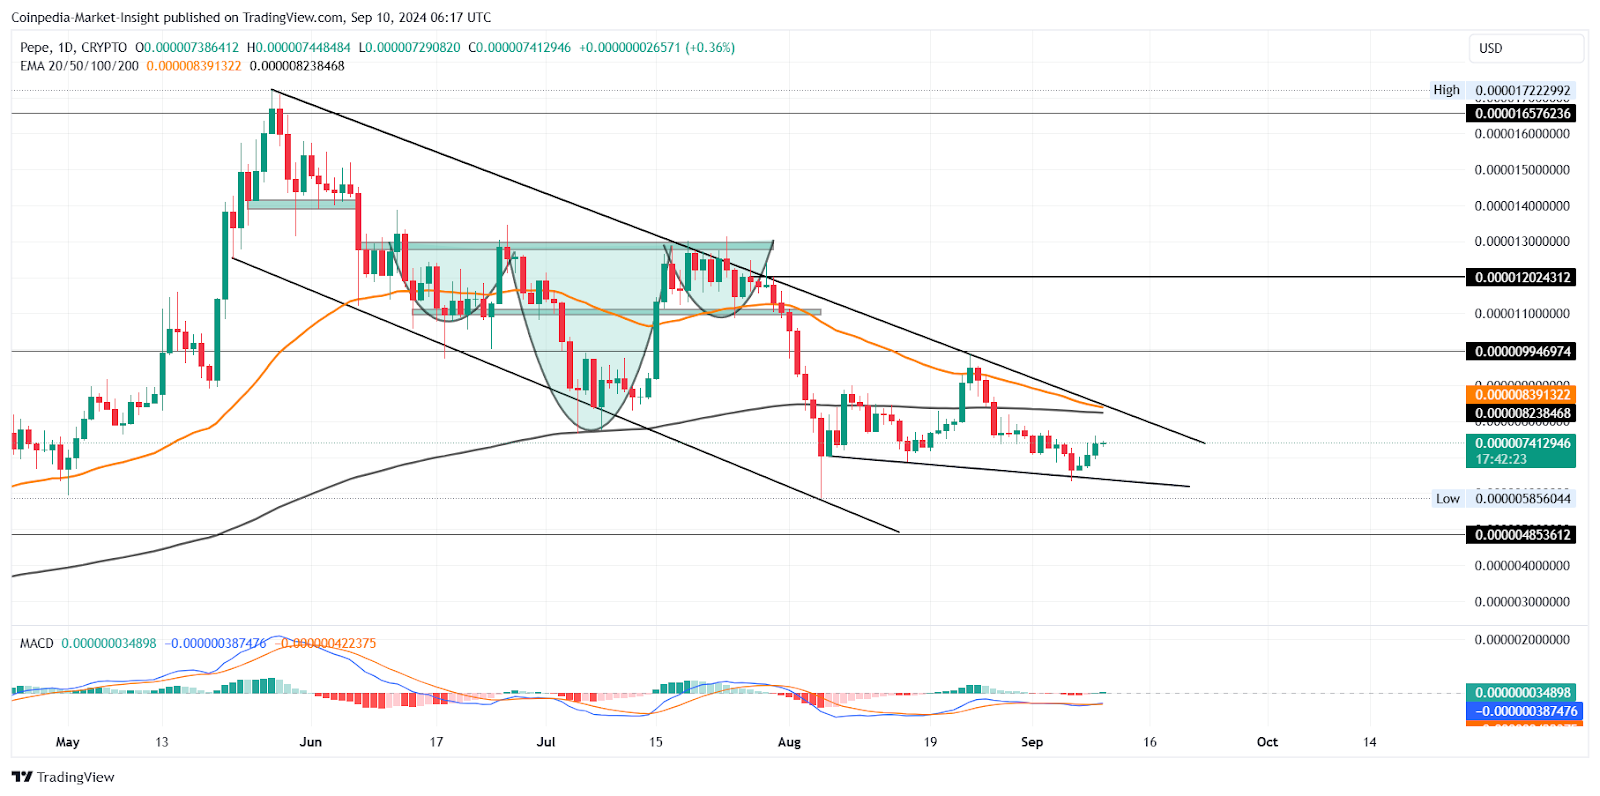
Despite the 50-day and 200-day EMA on the verge of a death cross, the recovery rally forms three consecutive bullish candles, accounting for a 12.23% jump. Currently, the memecoin is trading at $0.000007412 with an intraday gain of 0.36%.
As the new bull cycle gains momentum, the MACD indicator gives a positive crossover. Considering the uptrend gains momentum, it will likely challenge the merger of the 50- and 200-day EMA near the two overhead resistance trendlines.
Hence, the short-term upside for PEPE is 13.79% near the $0.000008405. In an optimistic case, a bullish breakout rally will have the upside potential of 63.50% to hit the $0.000001207 mark before scaling to the 125% of $0.0000016610.
Is PEPE’s 125% surge the final hit in 2024? Find the real potential in our PEPE Price prediction for 2024 and beyond.