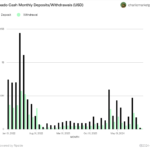
The balance of Litecoin (LTC) held by short-term holders over time showed that peaks corresponded with increases in the amount of LTC these holders possess. Sharp rises often preceded or aligned with notable price spikes.
As at press time, the balance of LTC held by short-term holders increased by 31% last month. These surges in holdings typically signaled increased market activity. Historically, such spikes have occurred around price bottoms. It suggests that short-term holders accumulate LTC when they anticipate a potential increase in its value.
The recent increase in balances could suggest that Litecoin was approaching a bottom or was set for an upward price movement soon. If this trend continues, we could see more price spikes for Litecoin as these holders could begin to sell off their holdings, capitalizing on rising prices.
– Advertisement –
This accumulation and subsequent potential sell-off cycle hinted on the speculative strategies often employed by short-term crypto investors.
Litecoin Wick Liquidates Leveraged Traders
As balance of short-term holders increased, so did price. However, LTC saw a sharp drop of 14% drop on Binance, marked by a huge downward wick that liquidated highly leveraged positions. The sharp price movement occurred in a very short timeframe. It indicated by the vertical drop on the candlestick chart, but swiftly rebounded near its initial level.
Before the drop, Litecoin traded relatively stable, with several buy and sell signals scattered across the chart, suggesting active trading. However, the sudden price decline pushed the Relative Strength Index (RSI) close to the oversold territory, a signal that LTC was heavily sold during the drop.
– Advertisement –

The Commodity Channel Index (CCI) also plummeted, confirming a sudden shift to oversold conditions.
The price action of LTC reset the market by eliminating over-leveraged positions, potentially stabilizing the price in the short term. This could be interpreted as bullish, expecting less volatility and more sustainable growth moving forward, as the market clears out speculative excesses and regains balance.
LTC at its All-Time Lows Against Bitcoin
Litecoin paired against Bitcoin painted a prolonged downtrend, with the price descending within a narrowing wedge pattern, signifying weakening strength against BTC. The Heikin Ashi candle consistently showed a bearish trend without signs of reversal.
The On-Balance Volume (OBV) line has trended downwards, indicating that selling pressure has consistently outweighed buying interest. The Stochastic RSI oscillated within normal ranges but failed to signal a strong reversal potential as it stayed predominantly in the lower half of the range, suggesting continued bearish sentiment.

Critically, the Commodity Channel Index (CCI), now at its lowest, indicated that LTC was extremely oversold relative to Bitcoin. Historically, similar conditions in 2015 led to a sharp reversal, as LTC rebounded strongly against BTC.
If history repeats, LTC could see a significant bullish reversal, likened to a “fully retracted elastic band” snapping back. This suggests potential for an aggressive upside correction as market conditions are overly bearish and may invite a surge of buying activity.


