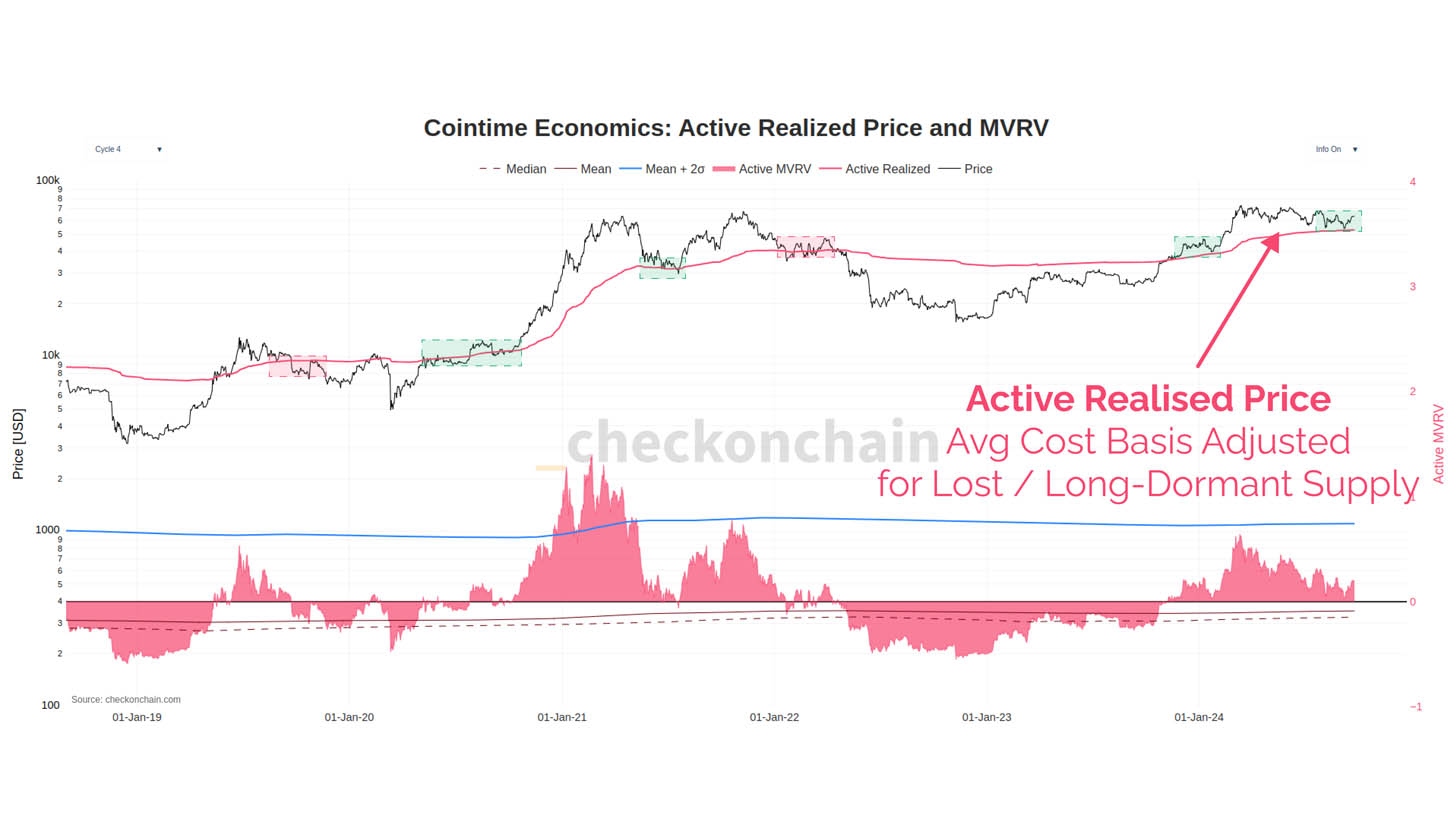
Research by _checkonchain analyst, Checkmate, and dpuellARK highlights a refined approach to evaluating Bitcoin’s active realized price, offering a more precise perspective on the cost basis of active market participants. The approach looks at Bitcoin’s realized price metrics, adjusted for lost and long-dormant supply, are shedding new light on market valuation trends.
The novel metric reveals a clearer picture of Bitcoin’s valuation cycles, capturing market sentiment by focusing on coins that have recently moved, thus excluding inactive supply.
The active realized price serves as a significant indicator of market performance. Over the past five years, it has functioned as a critical support or resistance level, with Bitcoin’s price frequently oscillating around this metric. Key observations from 2019 to 2024 include periods of overvaluation during market peaks, such as in 2021, when Bitcoin’s price surged above the active realized price, reflecting heightened investor energy.

Conversely, phases of undervaluation can be seen during correction periods, notably in 2022, when Bitcoin’s price fell towards the active realized price, aligning with market normalization. The recent accumulation phase in 2023-2024 suggests cautious optimism, with the active MVRV ratio indicating a more stable market environment. Bitcoin has now bounced off the active realized price twice, mirroring the earlier stages of the 2021 bull run.
The active MVRV ratio, comparing market value to realized value adjusted for active supply, identifies potential market tops and bottoms. High MVRV values have historically signaled overvaluation, while lower values suggest accumulation opportunities, offering nuanced insights into market cycles and investor sentiment.


