

 Shows Bullish Divergence but Faces Challenges")
 Price at Risk as Big Investors Begin Selling")


Bitcoin’s price has increased by nearly 5%, moving above $62,500, and is now testing the $63,500 resistance zone with a positive outlook. It established a stable base above $60,000, allowing it to rise past the $61,500 resistance zone.

Breaking a key bearish trend line at $61,000 on the BTC/USD hourly chart helped the bulls push the price above the $62,500 resistance, bringing it up nearly 5% and trading close to the $63,650 resistance zone.
Bitcoin Price Analysis: Potential Resistance Levels Ahead
Bitcoin’s price is trading above $62,500 and the 100-hourly Simple Moving Average. It remains stable and is well above the 23.6% Fib retracement level of the upward move from the $59,949 swing low to the $63,675 high.
If there is another increase, the price could face resistance near the $63,650 level. The first key resistance is near the $64,000 level, and the next key resistance could be $64,400. A clear move above the $64,400 resistance might start a steady increase and send the price higher.
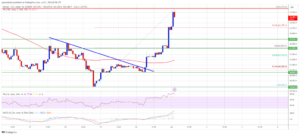
Source: BTCUSD on TradingView.com
In this case, the price could rise and test the $65,500 resistance. Any further gains might push BTC toward the $66,000 resistance in the near term.
Bitcoin Price Correction: Potential Support Levels
If Bitcoin fails to climb above the $63,650 resistance zone, it could start a downside correction. Immediate support on the downside is near the $62,800 level.
The first major support is $61,800, along with the 50% Fib retracement level of the upward move from the $59,949 swing low to the $63,675 high. The next support is forming near $61,250 and the 100-hourly Simple Moving Average. Any further losses might send the price toward the $60,500 support zone in the near term.
Technical Indicators:
- Hourly MACD: The MACD is gaining pace in the bullish zone.
- Hourly RSI (Relative Strength Index): The RSI for BTC/USD is now above the 50 level.
Major Support Levels: $62,800, followed by $61,800.
Major Resistance Levels: $63,650, and $64,400.
Important: Please note that this article is only meant to provide information and should not be taken as legal, tax, investment, financial, or any other type of advice.
Join Cryptos Headlines Community
Follow Cryptos Headlines on Google News
Authors