The price of Bitcoin is holding on to its recent losses, staying below $26,500. Bitcoin is showing signs that it might go down even more, possibly reaching $25,000.
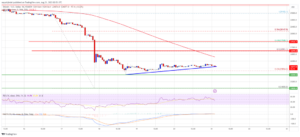
Bitcoin is having difficulty reclaiming the $26,600 resistance area. It’s currently trading beneath $26,500 and the 100-hourly Simple Moving Average. On the hourly BTC/USD chart (data from Kraken), there’s a small upward trend line forming, with support around $26,050. There’s potential for the pair to decline further and trade below the $26,000 support level.
Bitcoin Price Goes Down:
After reaching the support at $24,800, the price of Bitcoin began to rise. It went back up past $25,000 and $25,500.
The price managed to surpass the first hurdle, which was the 23.6% retracement level from the recent drop between the highest point of $29,180 and the lowest point of $24,800. However, there are challenges ahead around $26,600. Currently, it’s still trading below $26,500 and the 100-hourly Simple Moving Average.
Also, there’s a positive trend line forming in the short term, showing support at around $26,050 on the hourly chart for the BTC/USD pair. If Bitcoin can stay above this trend line, it might try to go up in value.
The first challenge ahead is close to $26,400. After that, the bigger challenge is at around $26,500 and the 100-hourly Simple Moving Average. If the price can move clearly above this moving average, it could initiate a rise towards the $27,000 resistance level.

Source: BTCUSD on TradingView.com
The price level of $27,000, which is halfway between the highest point at $29,180 and the lowest point at $24,800, might work as a barrier. If the price can close above this $27,000 point, it could begin to rise and aim for the next resistance at $27,500. If it continues to gain, it might even pave the way for a bigger increase towards $28,150.
BTC Could Experience Another Drop?
If Bitcoin can’t get past the $26,500 hurdle, it might keep going down. The first support if it goes down is around $26,000 and the trend line.
The next important support comes in at about $25,600. If the price goes below this $25,600 level, it could enter a more bearish situation. If that happens, the price could head towards $25,000.
Technical Analysis:
- Hourly MACD – The MACD is showing increasing bearish momentum.
- Hourly RSI (Relative Strength Index) – The RSI for BTC/USD has dropped below the 50 mark.
- Key Support Levels – $26,000, then $25,600.
- Key Resistance Levels – $26,500, $27,000, and $27,500.
Important: Please note that this article is only meant to provide information and should not be taken as legal, tax, investment, financial, or any other type of advice.
Join Cryptos Headlines Community
Follow Cryptos Headlines on Google News


