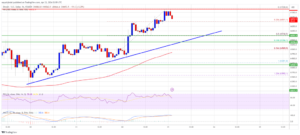
The price of Bitcoin continued to rise and surpassed the $66,000 resistance level. BTC is now displaying positive indicators and could attract buyers around the $65,500 mark.
Bitcoin surged above the $65,500 resistance area, now trading above both $65,500 and the 100 hourly Simple Moving Average. On the hourly chart of the BTC/USD pair sourced from Kraken, a crucial bullish trend line is emerging with support at $65,700. While there might be a correction downwards, bulls are likely to stay active around the $65,500 support level.
Bitcoin Price Analysis: Bullish Momentum Continues
Bitcoin’s price has initiated a fresh upward movement, surpassing key resistance levels at $64,500, $65,000, and even $66,000. Bulls successfully drove the price to a new weekly high at $67,200, where it is presently consolidating its gains.
Currently, the price is gradually retracing lower towards the 23.6% Fibonacci retracement level of the upward move from the $64,281 swing low to the $67,200 high. Nevertheless, Bitcoin remains above $65,500 and the 100-hourly Simple Moving Average.
Furthermore, a significant bullish trend line is forming with support at $65,700 on the hourly chart of the BTC/USD pair. This trend line coincides with the 50% Fibonacci retracement level of the upward move from the $64,281 swing low to the $67,200 high.
In terms of resistance, the immediate barrier lies near the $67,000 level, followed by the first major resistance at $67,200. Beyond that, the next resistance zone stands at $68,500. A clear breakthrough above this level could sustain the upward momentum, with potential further gains towards $70,000.

Source: BTCUSD on TradingView.com
Looking ahead, the next major resistance level is anticipated near the $70,500 zone. Any additional upward movement could propel Bitcoin towards the $72,000 resistance area in the short term.
Bitcoin Price Forecast: Potential Correction Ahead
If Bitcoin fails to break above the $67,000 resistance zone, it may initiate a downside correction. Immediate support is expected around the $66,500 level.
The first major support zone lies at $65,700, corresponding to the trend line. A close below $65,500 could signal further downward movement towards $65,000. Additional losses might push the price towards the $64,200 support area in the near term.
Technical Indicators
- Hourly MACD: The MACD is currently showing a slowdown in bullish momentum.
- Hourly RSI (Relative Strength Index): The RSI for BTC/USD is presently above the 50 level, indicating positive momentum.
Key Support Levels: $66,500, followed by $65,500.
Key Resistance Levels: $67,000, $67,200, and $68,500.
Important: Please note that this article is only meant to provide information and should not be taken as legal, tax, investment, financial, or any other type of advice.
Join Cryptos Headlines Community
Follow Cryptos Headlines on Google News


